Thermography is based on the principle that induced heat in mechanical components causes a different temperature field in the area of defects or inhomogeneities. The digital image correlation is a powerful system for measuring and visualizing strain, deformation and 3D surface shape.
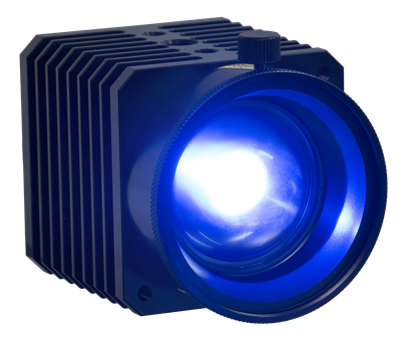
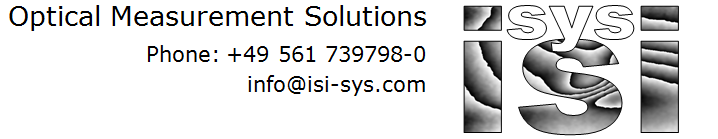
The VIC-3D IR System features an infrared (IR) camera that is integrated with the DIC cameras enabling temperature data to be accurately acquired and analyzed with the full-field strain and deformation data. The system works by first calibrating the intrinsic optical parameters of the IR camera and then calibrating the position of the IR camera relative to the stereo DIC system. This triangulation allows VIC-3D to place the thermal and strain (or deformation) as well as 3D surface data into a common coordinate system.
The calibration procedure has been streamlined by integrating the IR camera into our VIC-Snap image acquisition software, which allows the user to capture images from the IR and DIC cameras simultaneously. The result is an easy to use turn-key thermal imaging system that utilizes digital image correlation to accurately measure temperature and strain concurrently without any contact with the sample. Thermal and strain data can be viewed, analyzed, and extracted over the entire field or at precise locations.
The system is sold as a turn-key solution which includes all software, hardware, onsite installation, and one year of unlimited technical support and software upgrades giving you piece of mind that your system functions as intended, so you can start acquiring data immediately. This unique thermal integration capability may also be added to any existing VIC-3D system for increased functionality.
System Configuration and Features
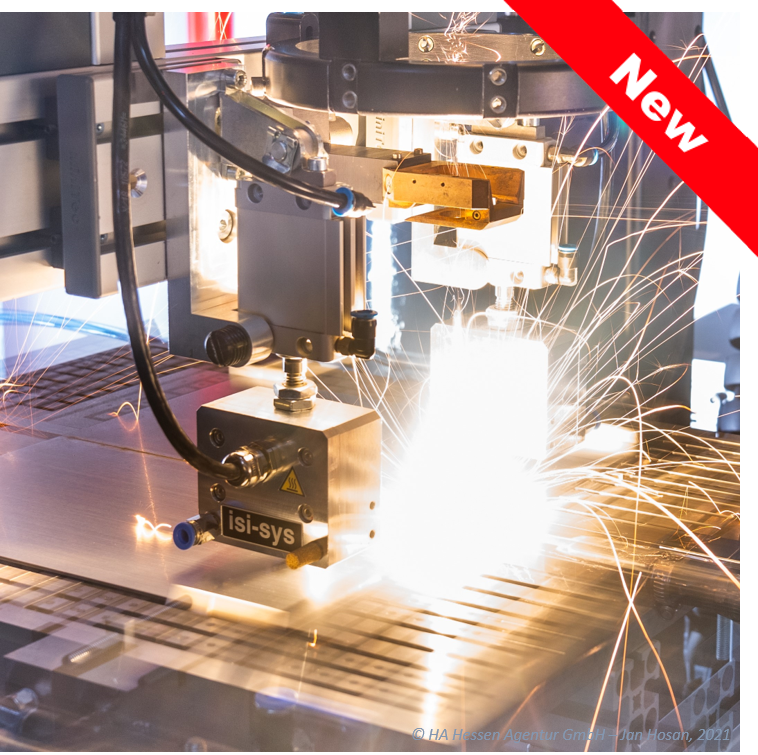
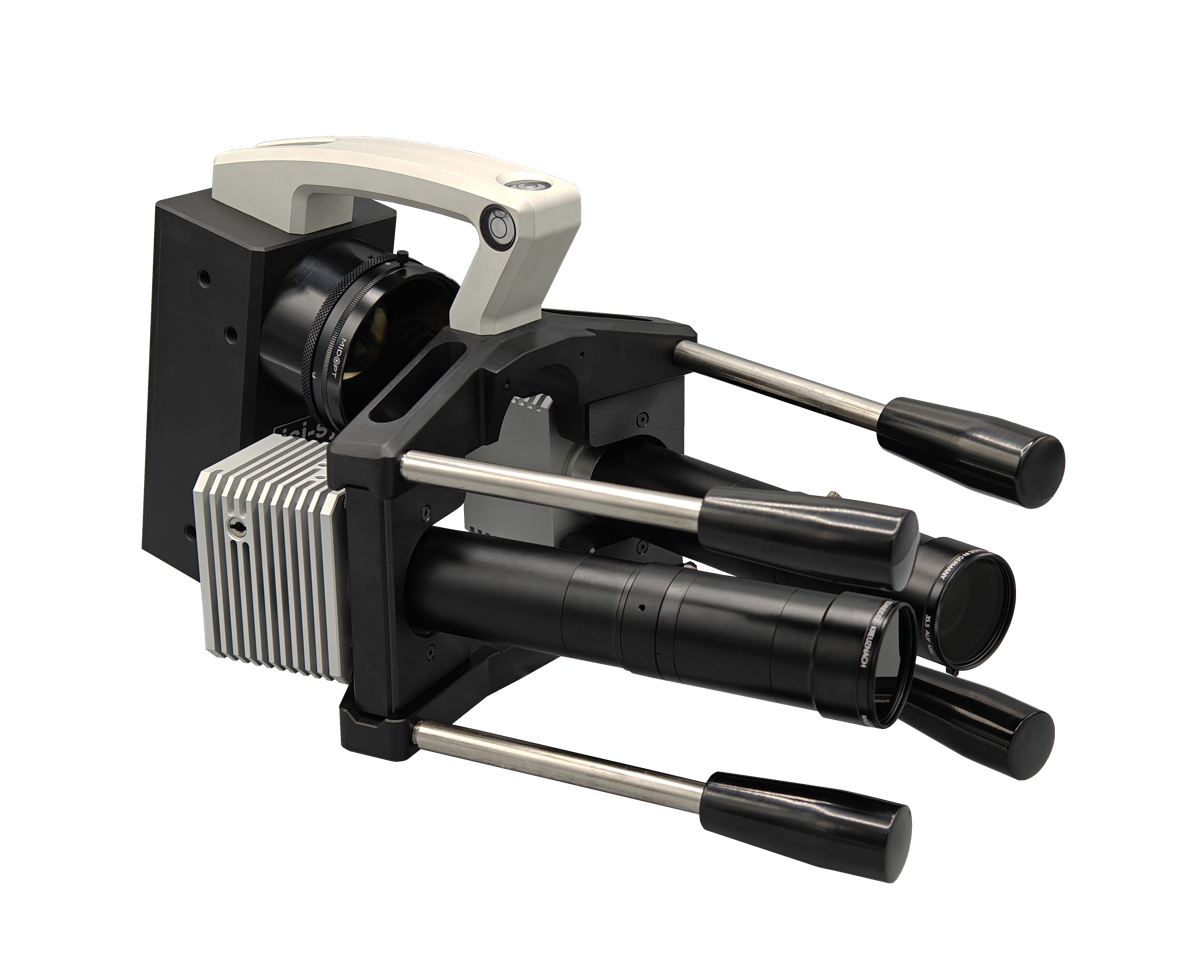
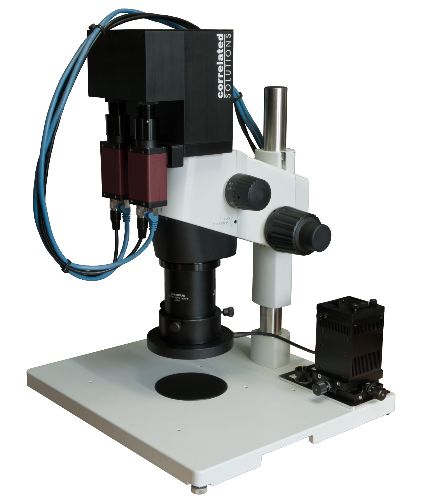
Both the IR camera for thermography and the two CCD cameras for 3D image correlation are mounted on a standard stereo bar.
- Temperatures up to 2,000C
- Synchronized IR and DIC images
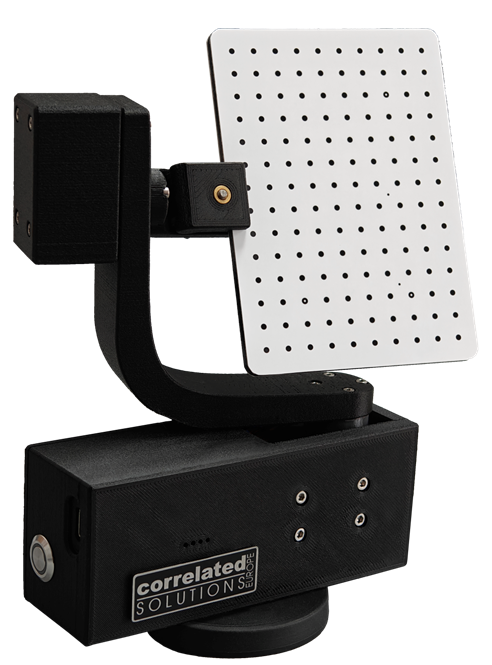
- User-friendly setup and calibration
- Uniquely designed IR calibration targets
- Analog data synchronization
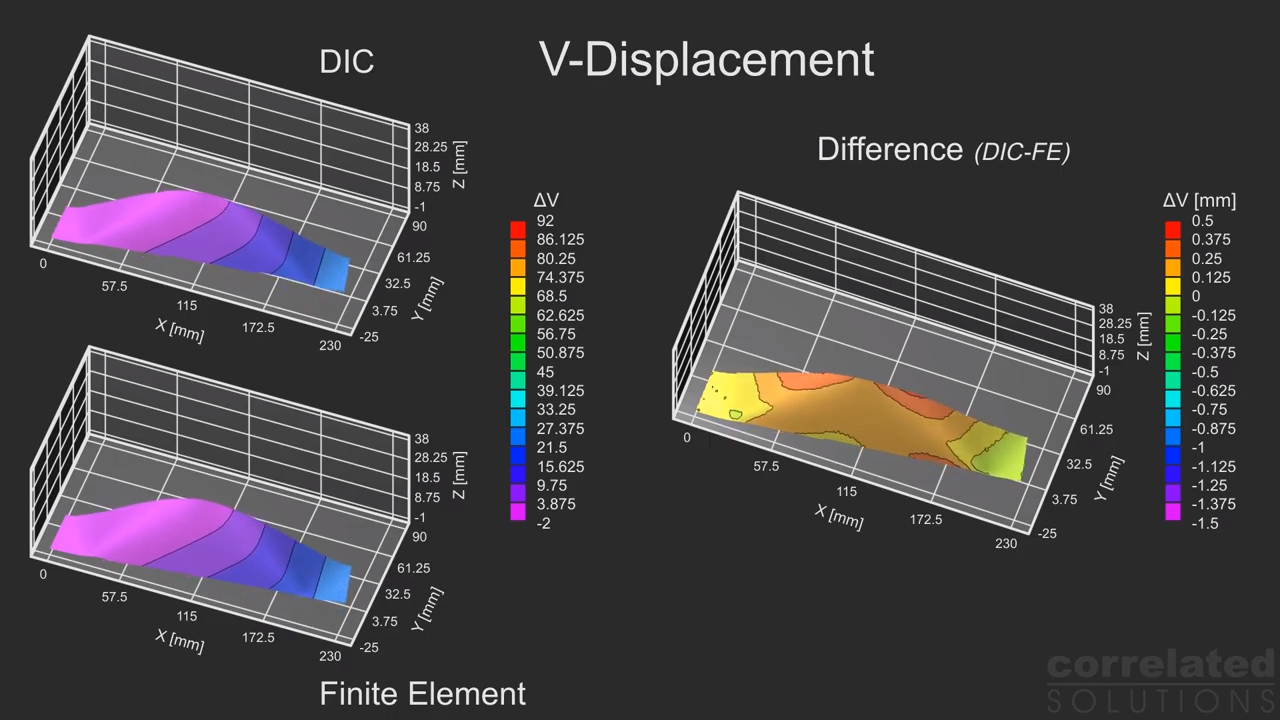
- Extract points, regions, or node locations for FEA validation
- Accurately measure deformation and thermal data concurrently
- Remotely view and acquire images using the Vic-Snap remote
- Measure 3D full-field displacements and strains
- All the features for the VIC-3D system included
Advantages of this multi-function device are all applications with component deformations caused by thermal energy like current flow. This product allows a simultaneously determination of the heat flows as well as strain and deformation.
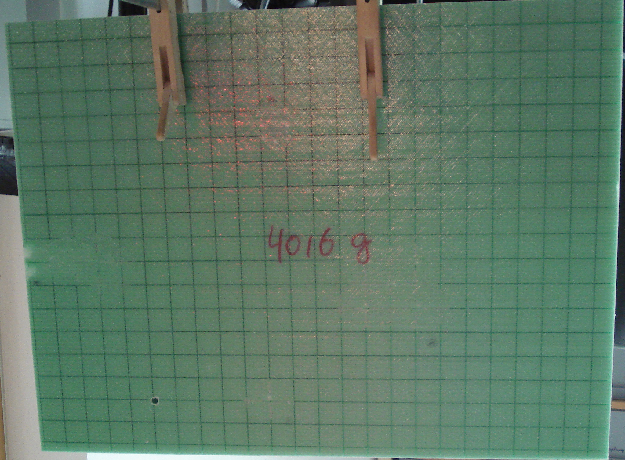
Example 1: Photovoltaic Module
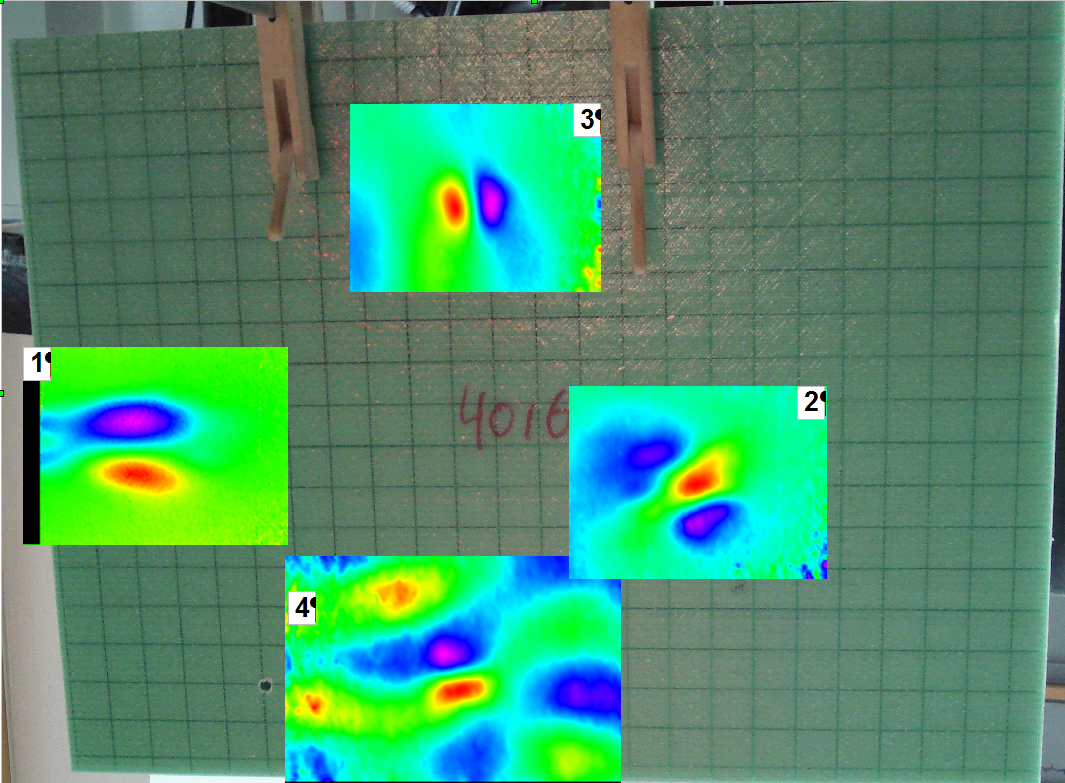
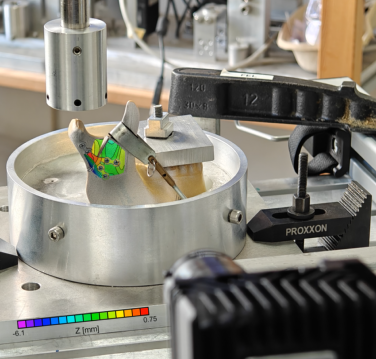
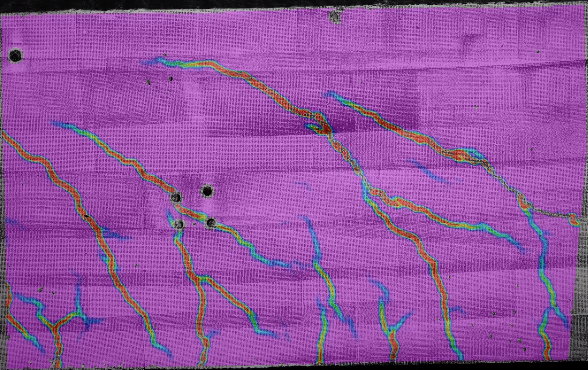
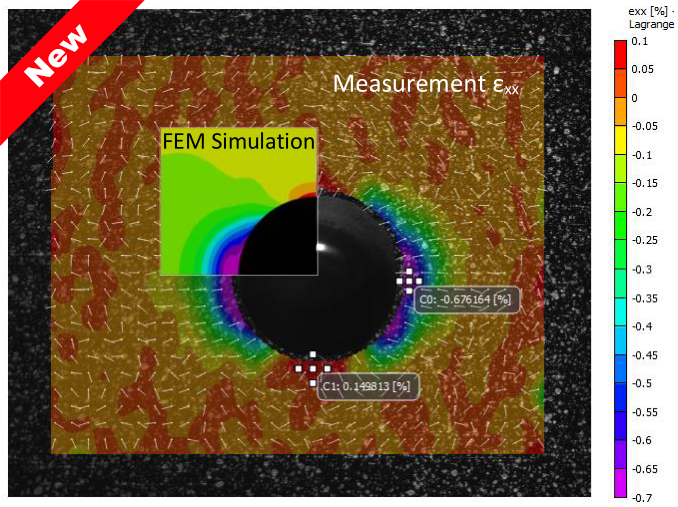
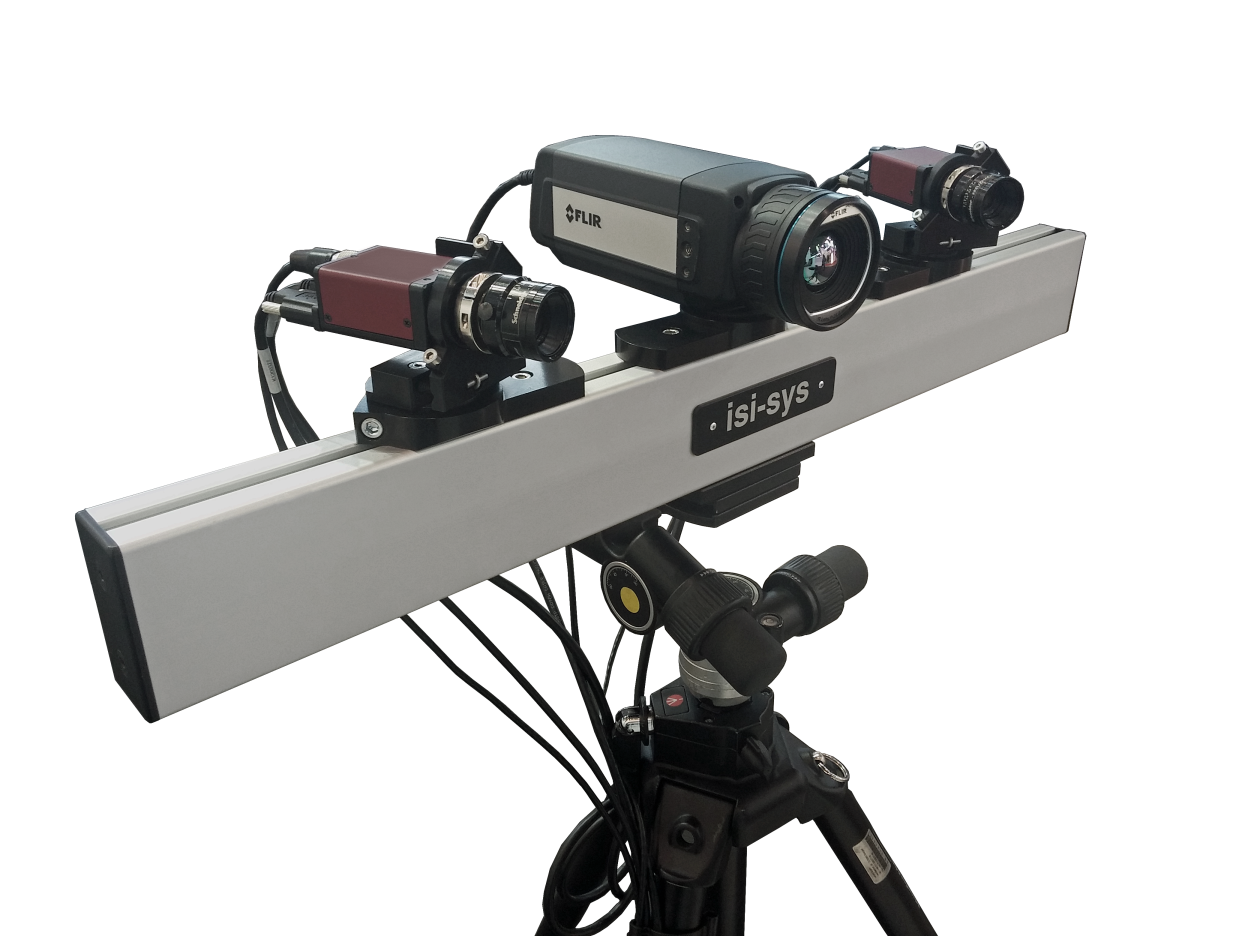
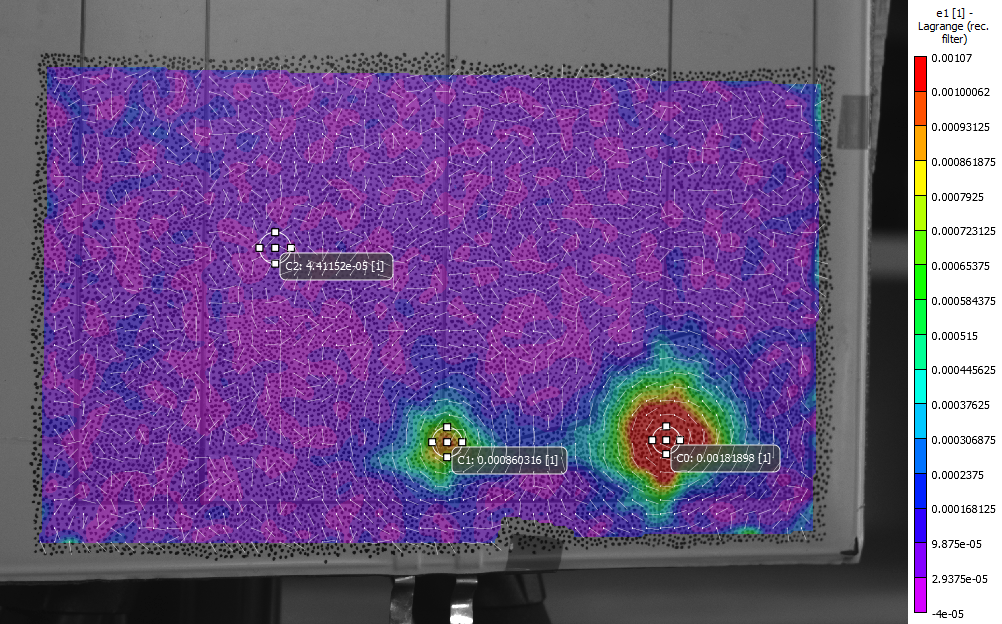
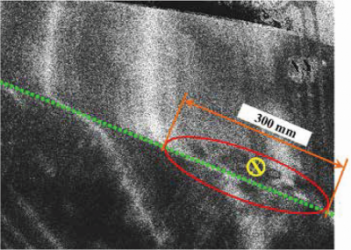
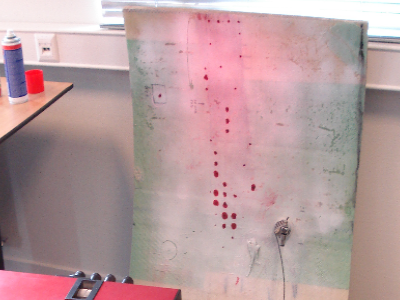
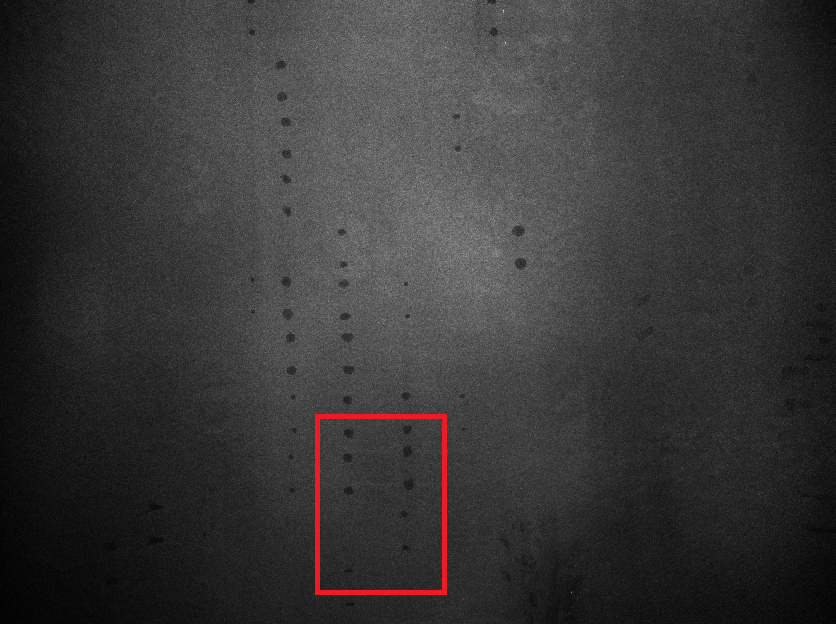
Defective photovoltaic modules have been measured during operation over several minutes. A preparation with speckle pattern is necessary for digital image correlation (here the backside of the panel). The marked areas are heated up due to electric/mechanical errors during operation.
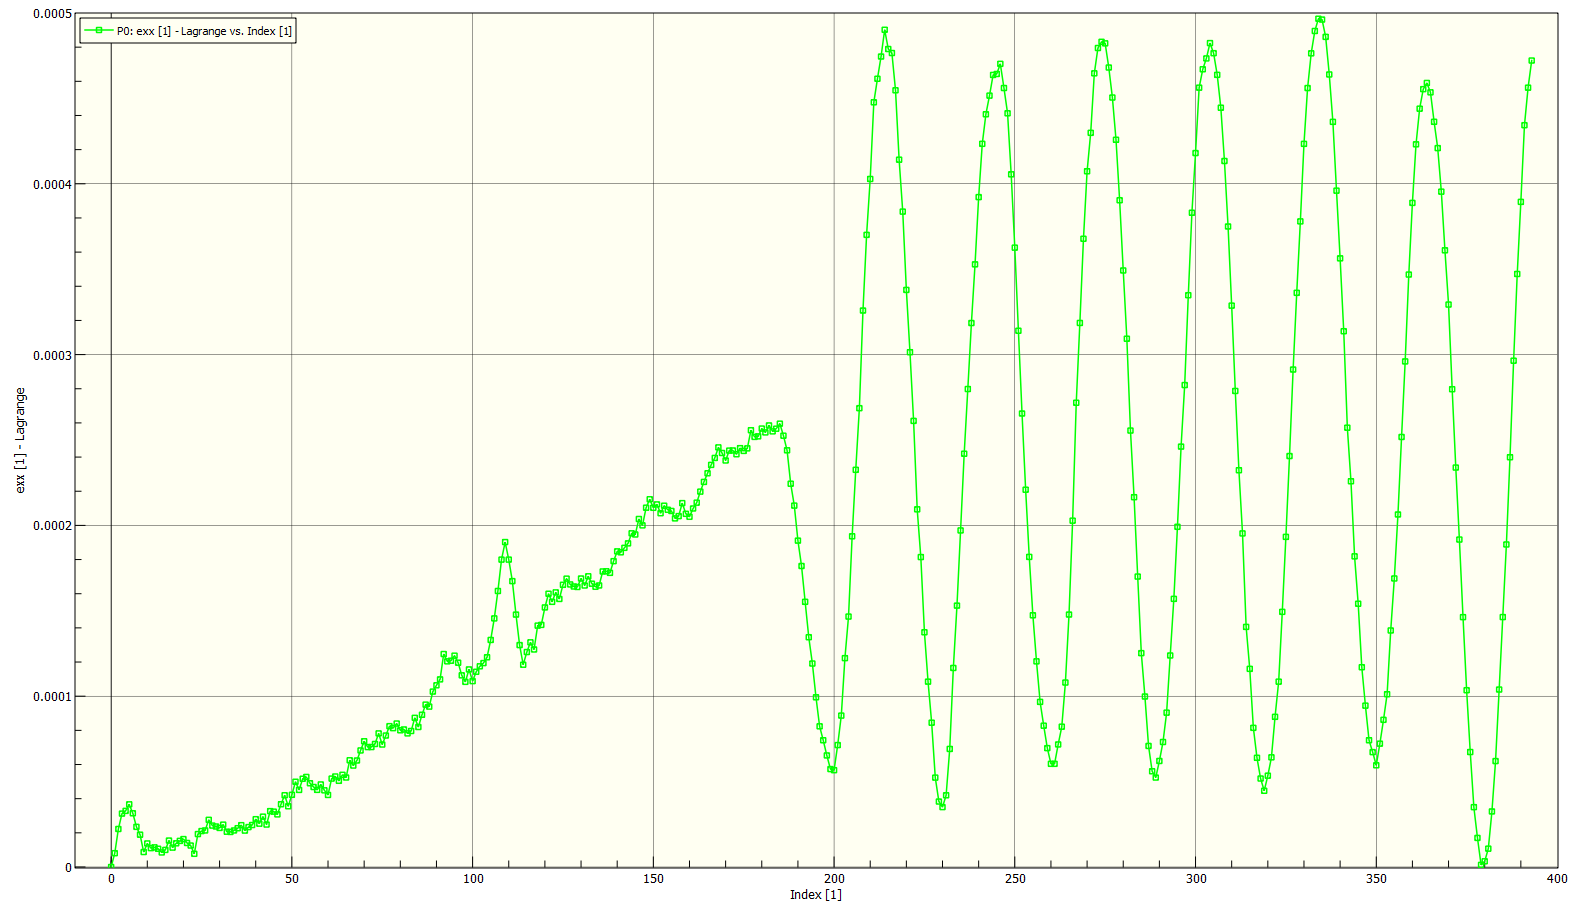
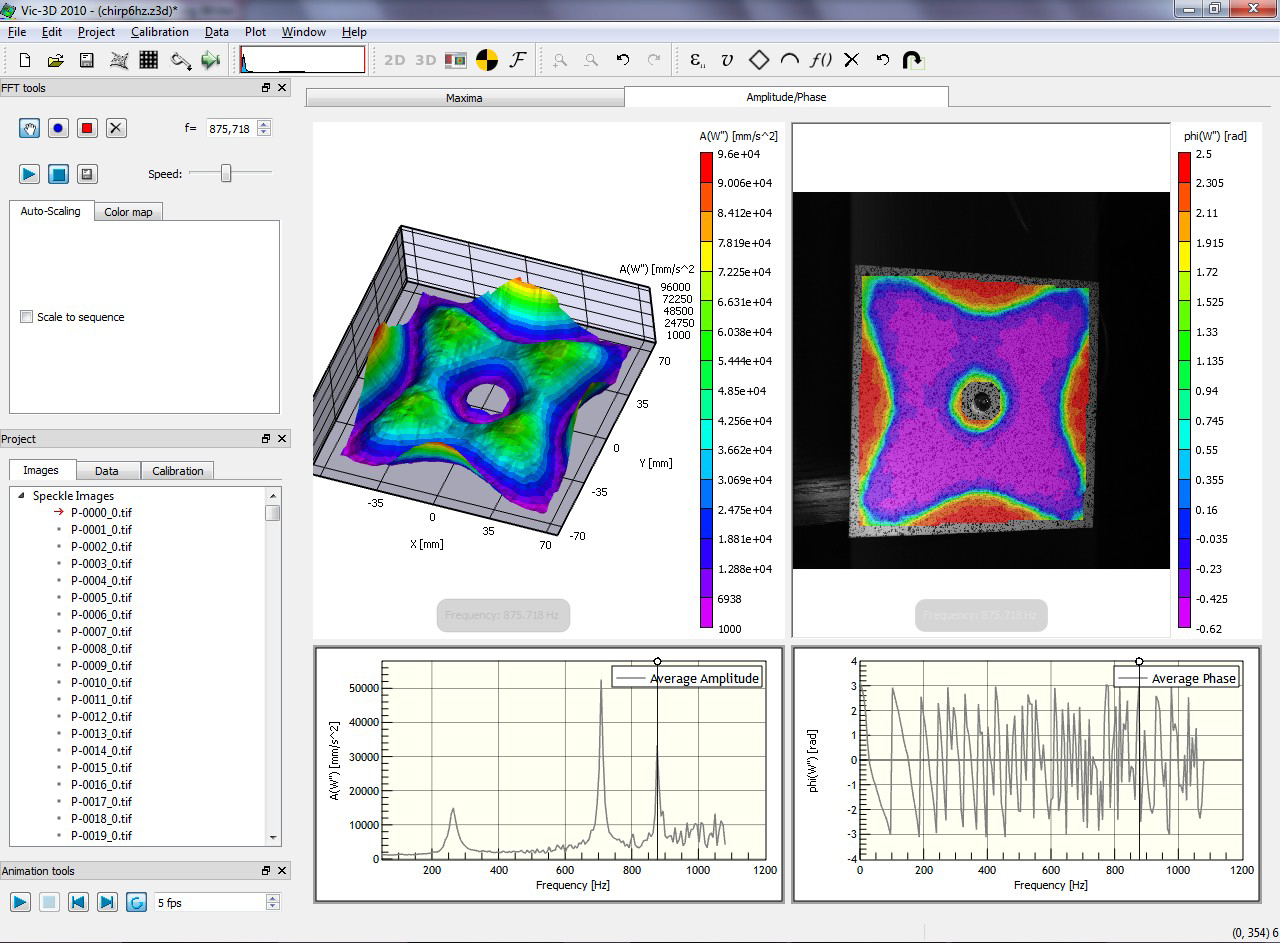
Principal strain (epsilon 1) over time (index) of the points C0, C1, C2 shown in the image below. Following three dimensional presentation of the temperature values.
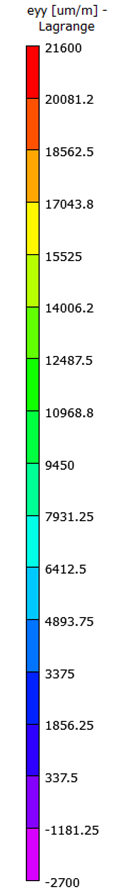
Three dimensional graph of the conture, superposed with the measured temperature (colour scale).
Three dimensional graph fo the conture, superposed with the strain measurement (colour scale).
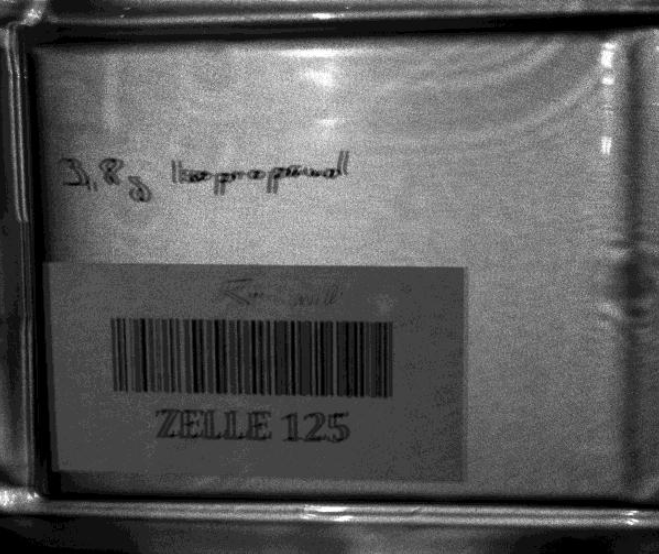
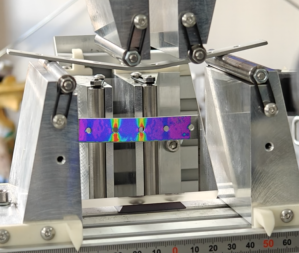
Example 2: Analysis of simultaneous one-sided heating and compressive loading on an e‑glass/vinyl ester/ balsa wood sandwich composite sample
Understanding thermo-mechanical behavior of material can be a vital component when designing vehicles and structures that may become exposed to high temperatures. Virginia Tech’s Extreme Environments, Robotics, and Materials (ExtReMe) Laboratory focuses on the impact of extreme environments on materials. This includes research that is focused on understanding the thermo-mechanical behavior of materials both during and following fires. Experimental investigations are performed to understand the evolution of the material due to elevated temperature.
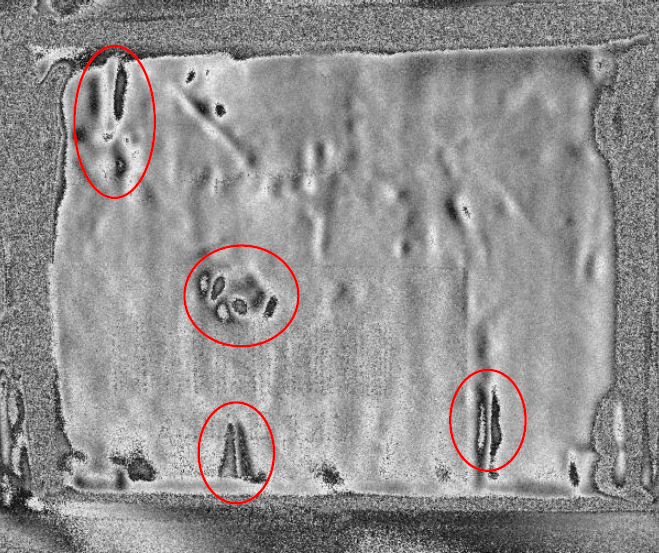
The senior research associates in the lab used the VIC-3D IR system to find the effects of a simultaneous one-sided heating and compressive loading test on an e‑glass/vinyl ester/balsa wood sandwich composite sample. As one researcher stated, “The VIC-3D IR system identi ed several transient events during the compression tests which would not have otherwise been fully understood using either DIC or IRT independently. Through this testing, several features of sandwich composite thermomechanical behavior were elucidated which would not have been possible with traditional point measurements (e.g. strain gages, defectometers, or thermocouples).”
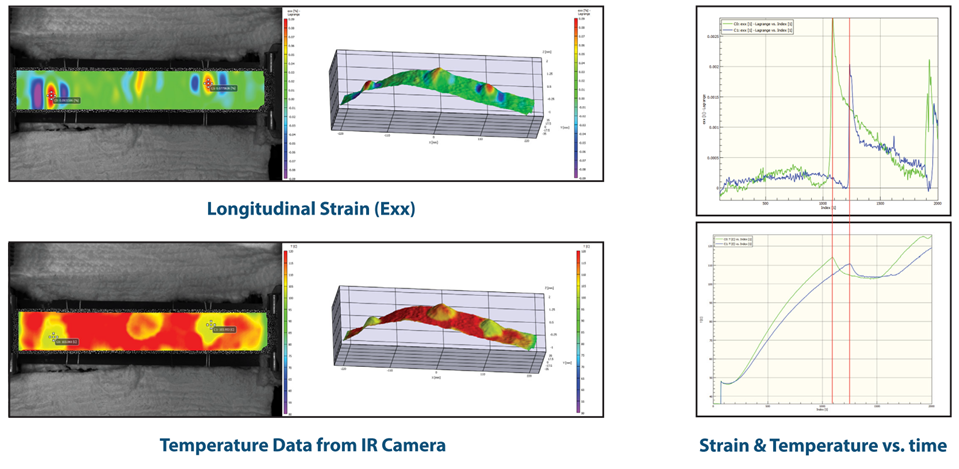
Image above: Analysis of simultaneous one-sided heating and compressive loading on an e‑glass/vinyl ester/ balsa wood sandwich composite sample, Identifying several transient events, which would not have been fully understood (stated by the enginners of Virgina Tech´s ExtReMe Laboratory) using either DIC or IRT independently or only applying traditional point measurements (e.g. strain gages, deectometers, or thermocouples). Source: Virgina Tech´s ExtReMe Laboratory
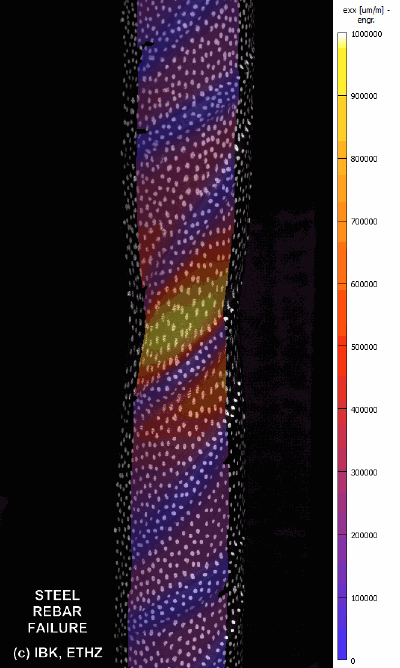
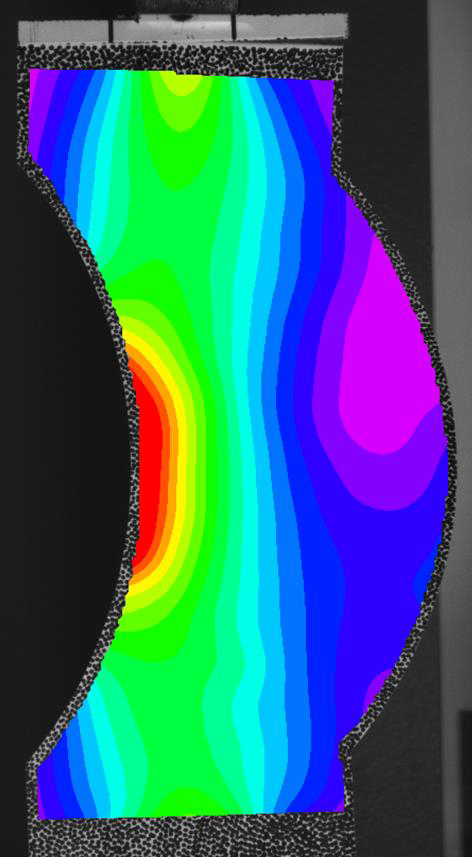
 left: Live view of surface including shearing.