Application examples of a special stereomicroscope in combination with Vic-3D digital image correlation on electronic components.
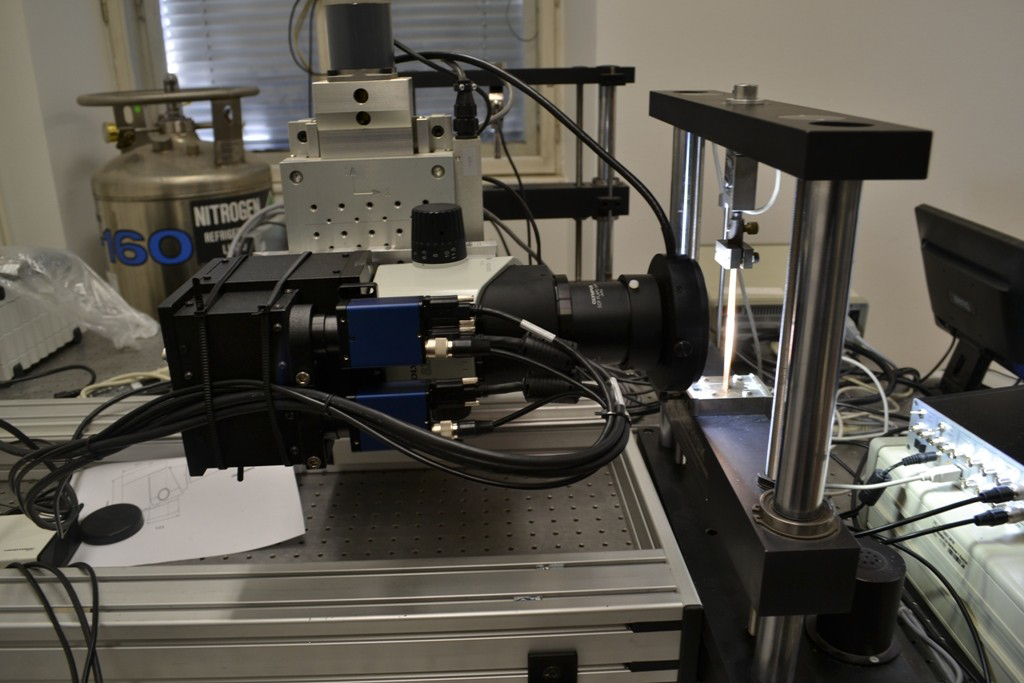
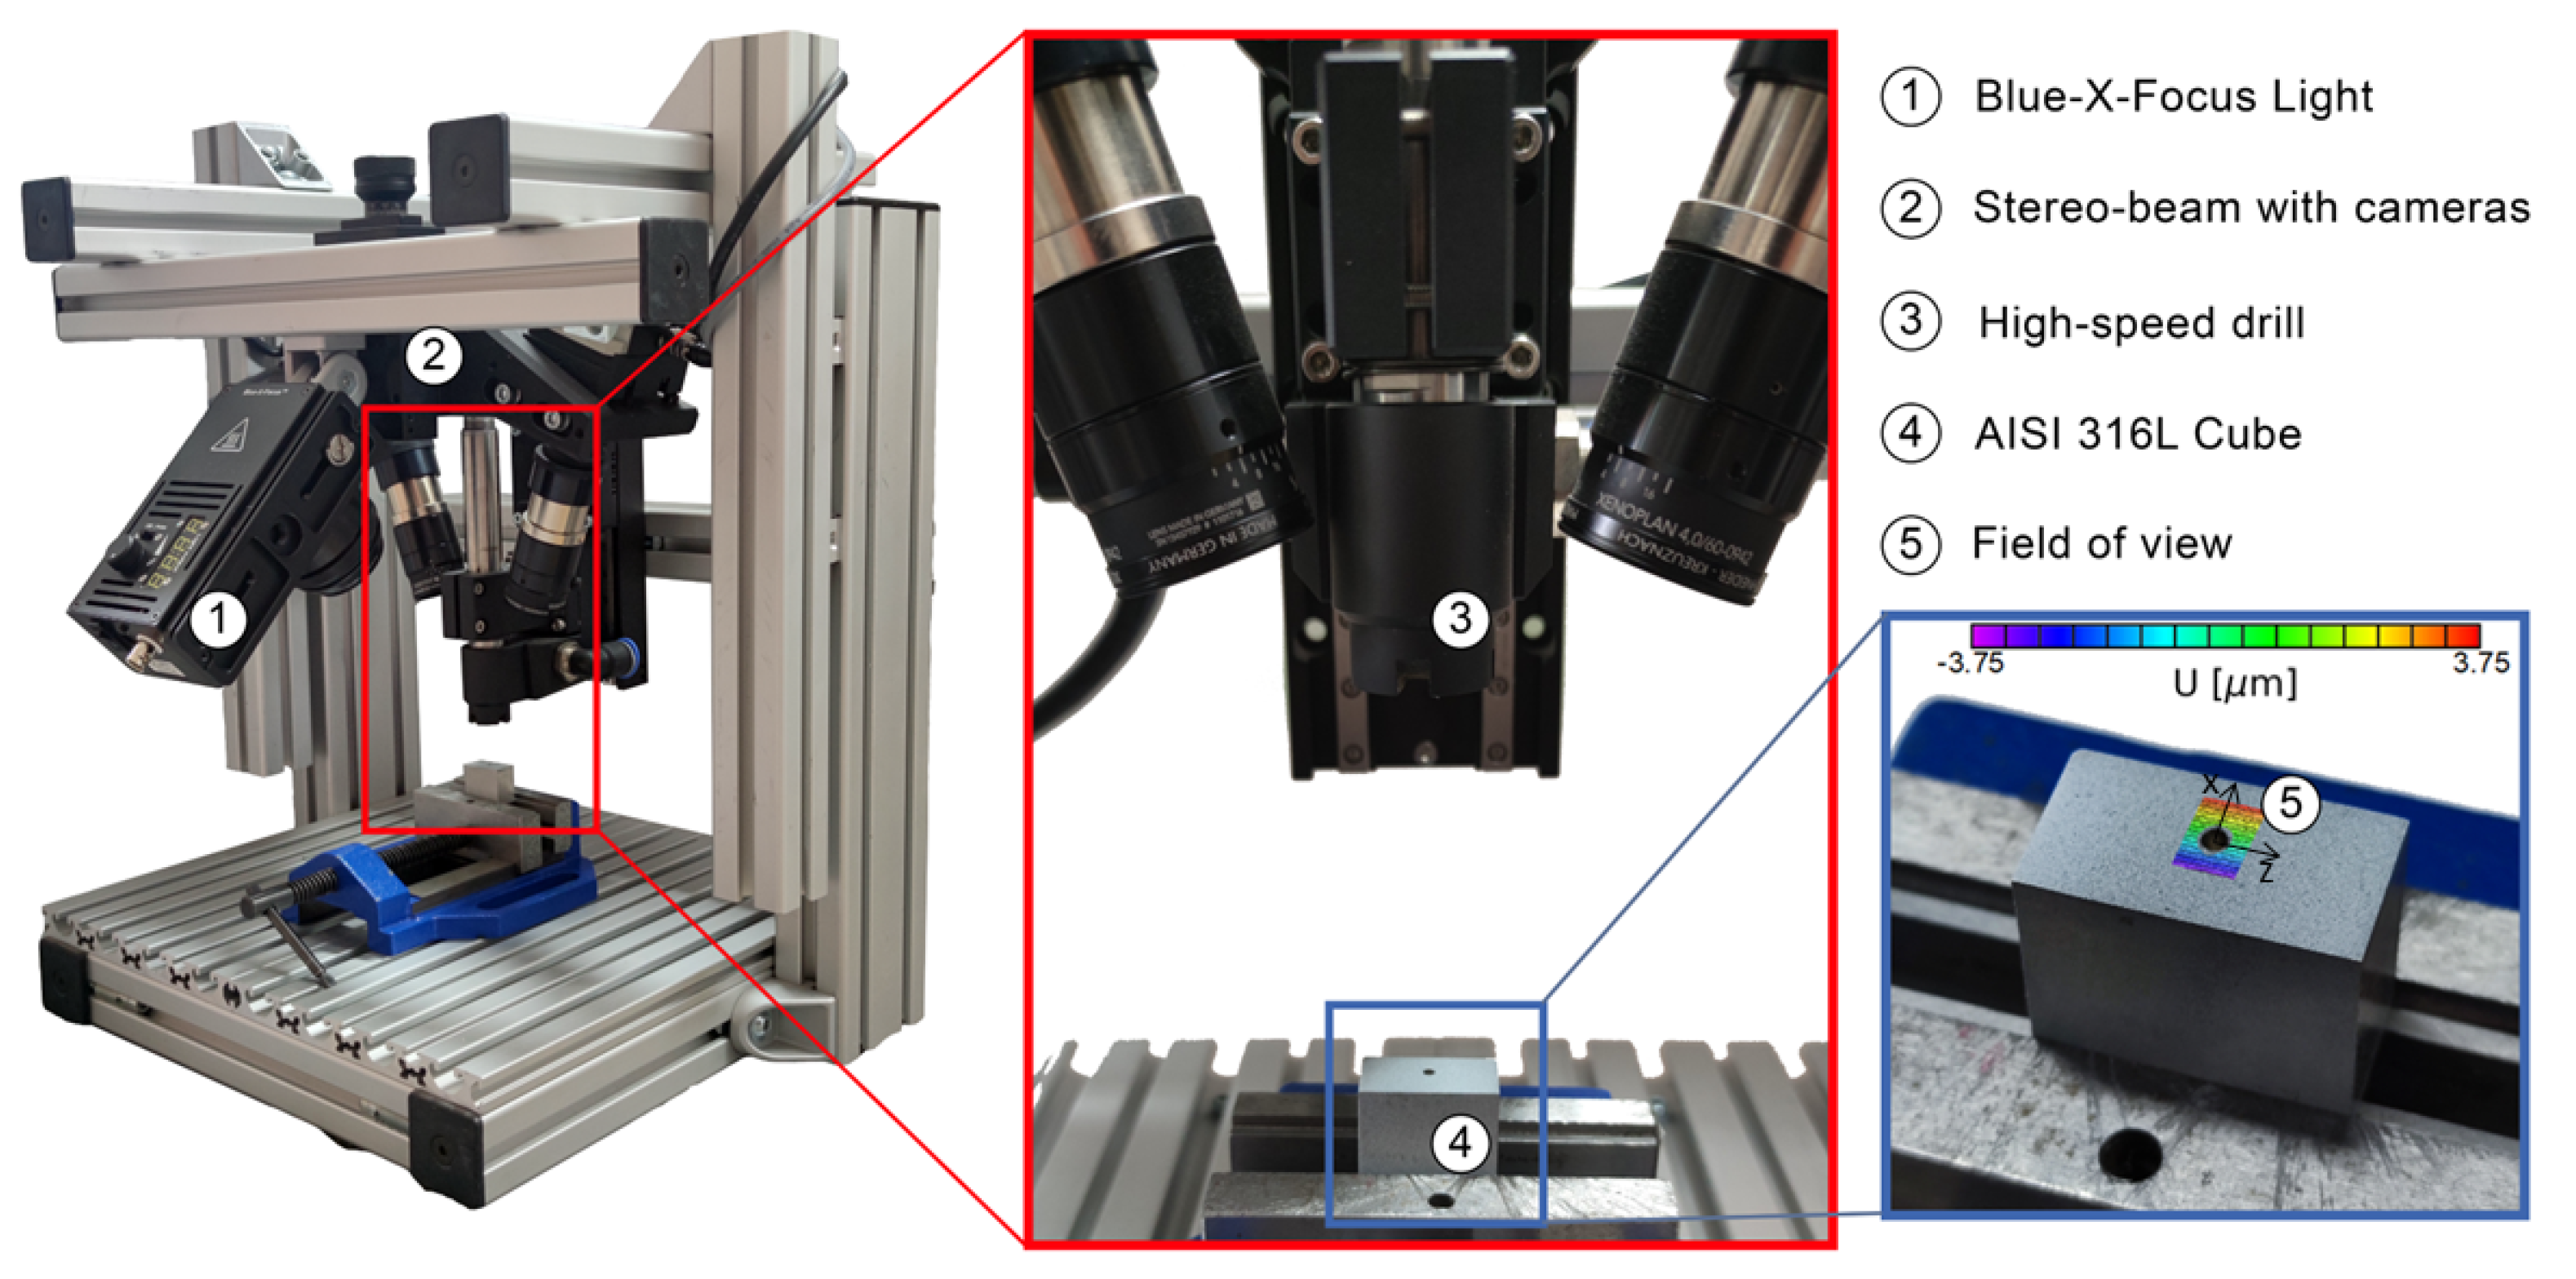
Image 1: Measurement setup
Measurement set up: Stereo microscope mounted on x‑y-z-microtable (backside) and tensile machine (right).
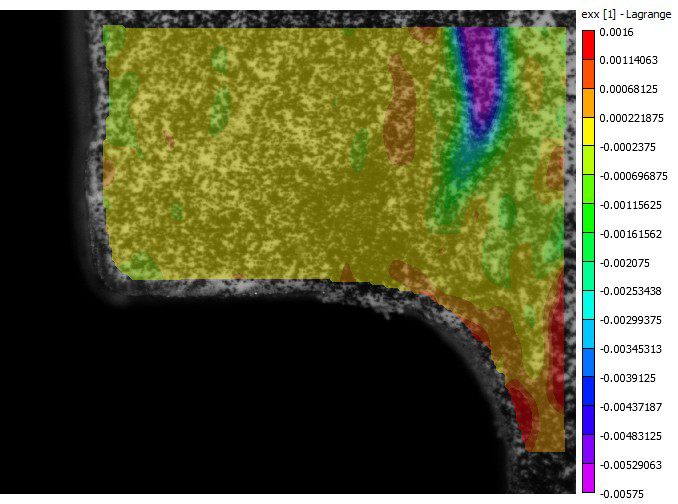
Image 2: Strain in x‑direction
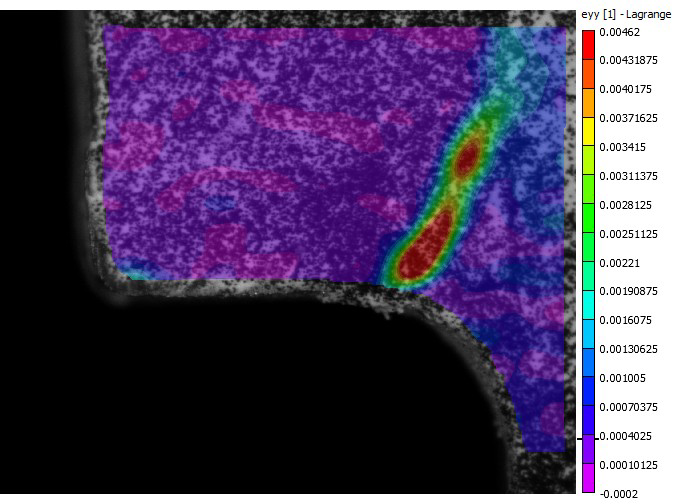
Image 3: Strain in y‑direction
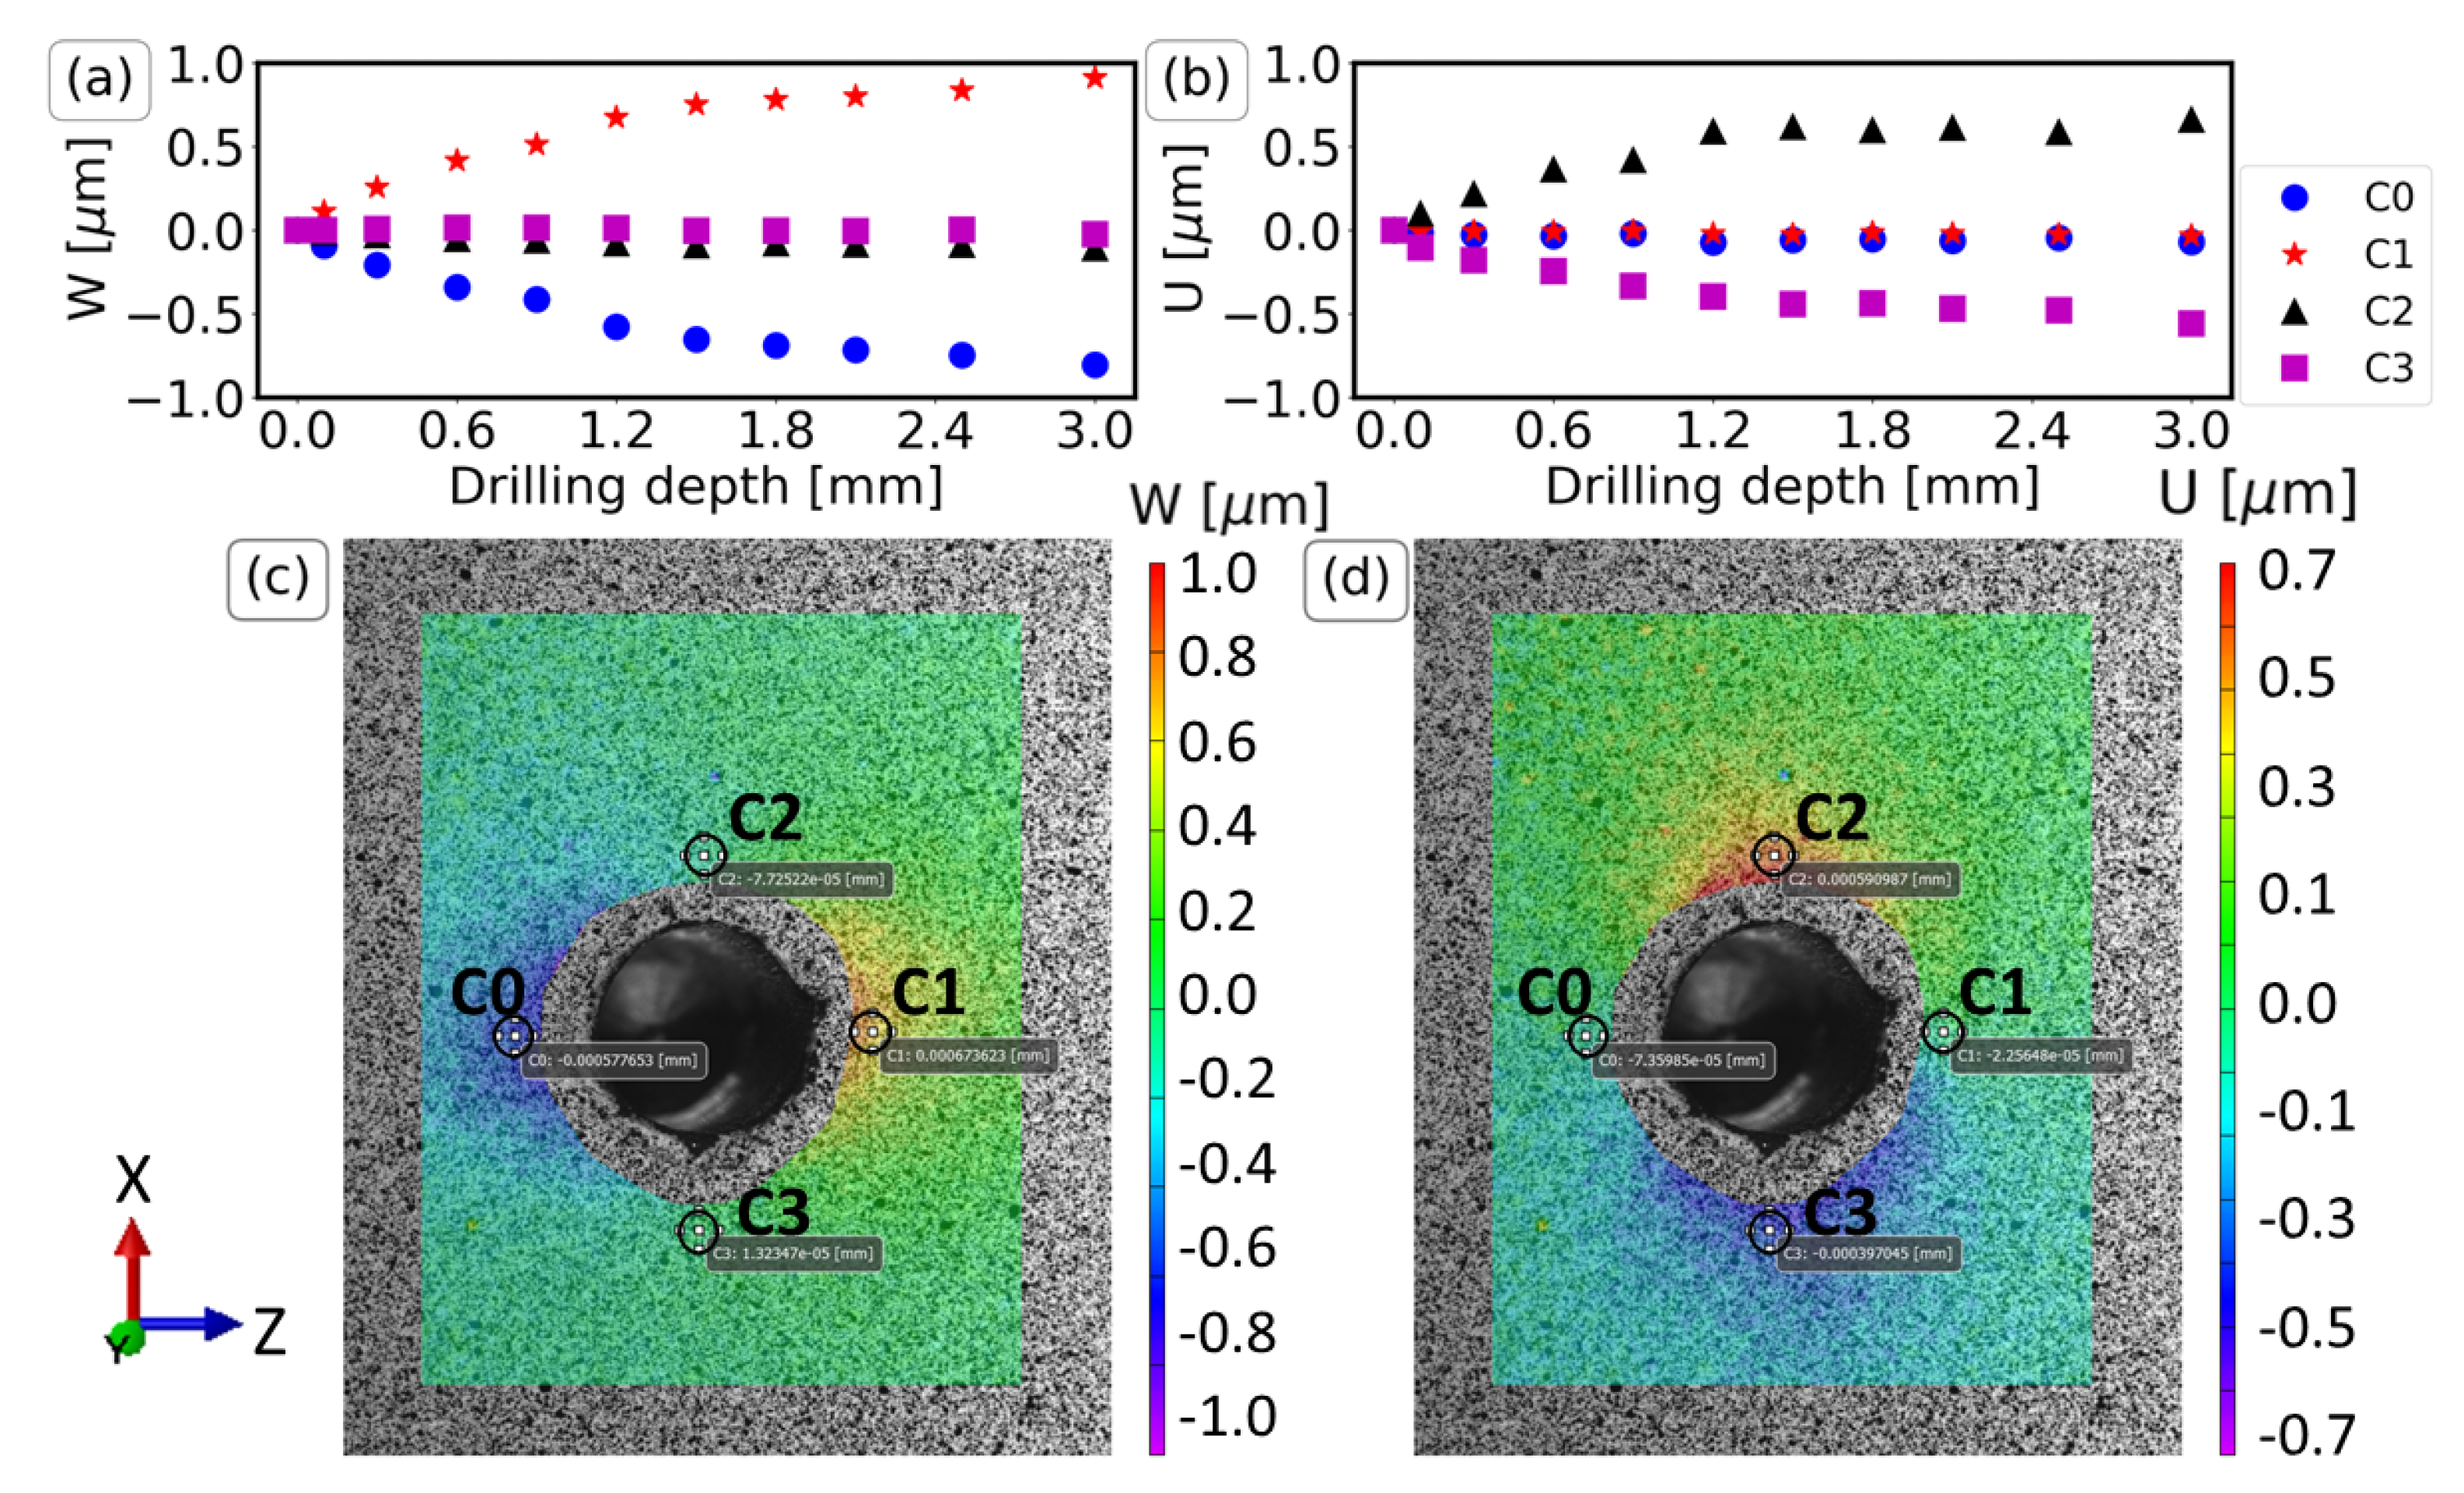
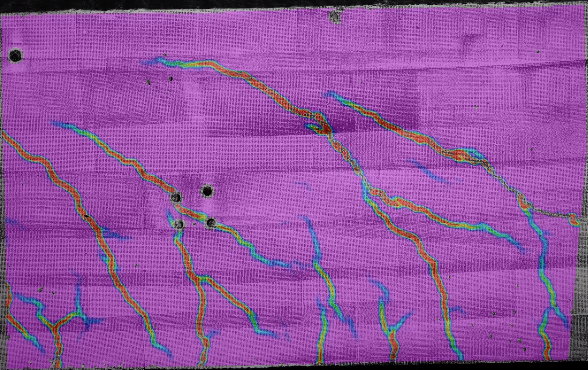
Strain distribution of a half cut capacitor-chip (left part) and its soldering area (round section). The board is under
bending load. The board is vertical on the right sight of the image. The local red area is showing a crack in the
soldering part. Image area approx. <2mm.
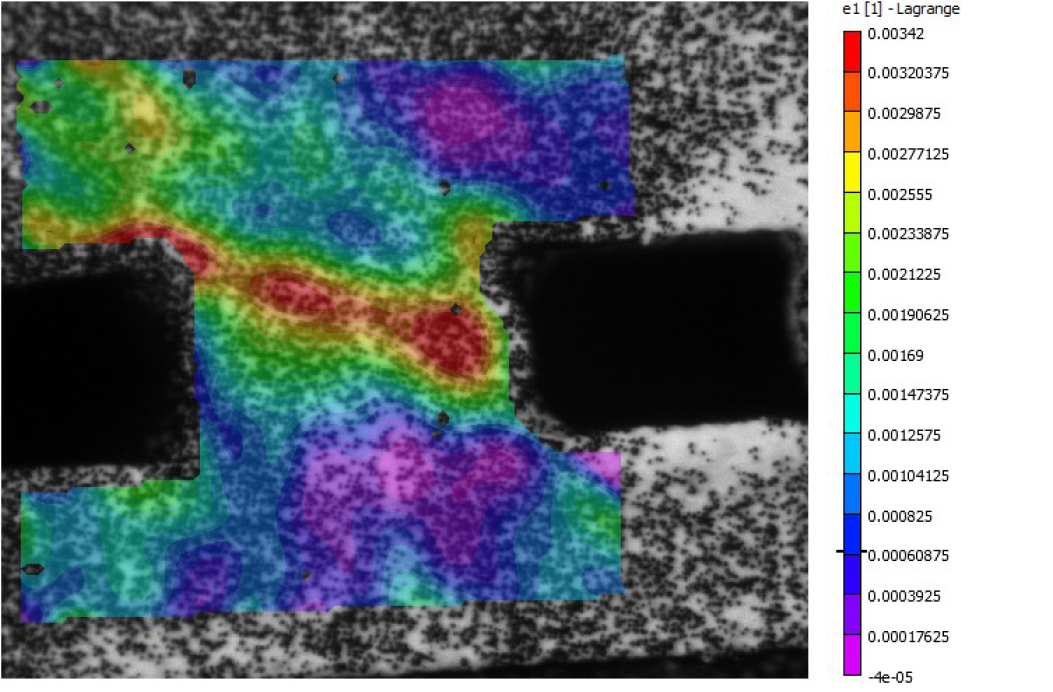
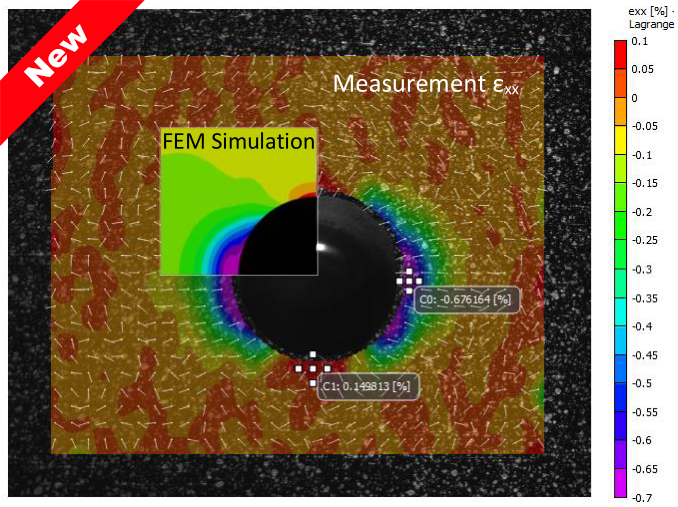
Image 4: The main strain of measuring a solder ball d=300µm under horizontal shear stress is shown.