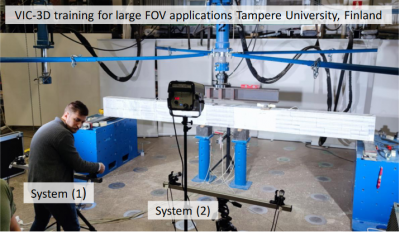
 Parallel use of stereo systems
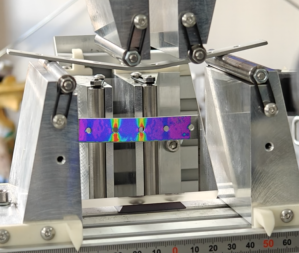
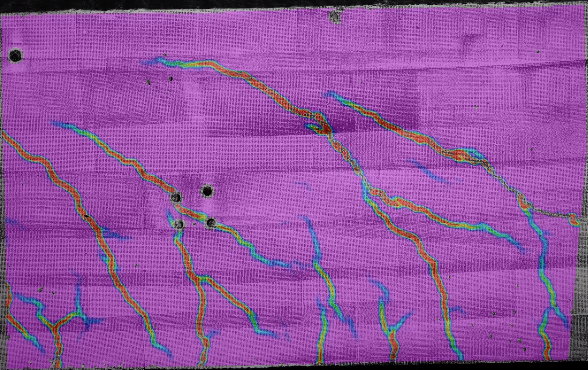
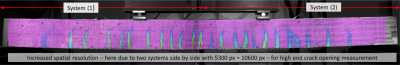
Applying multiple systems enables the enlargement of the FOV and/or to increase the spatial resolution. Different methods are available for combining their results and coordinates by the VIC software. A unique method with higher accuracy than onventional ones enables to combine any observation directions — in this example, side by side systems (right image) — even without an overlap of the FOV, which is required for the conventional stitching method. This doubles the spatial resolution.
Flexibility in combination of multiple systems
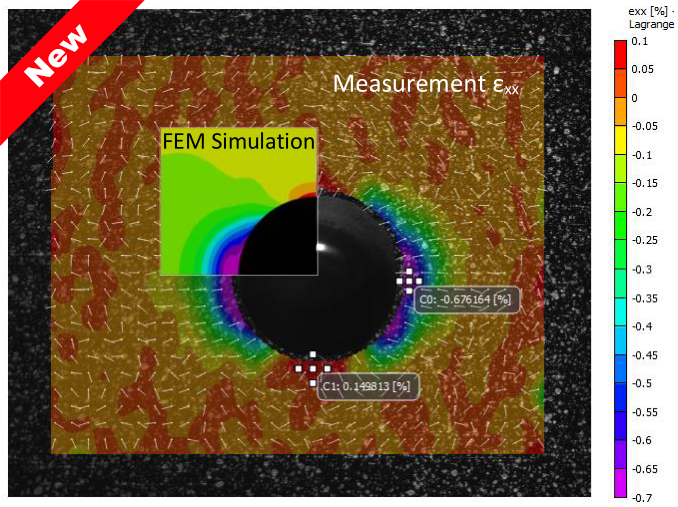
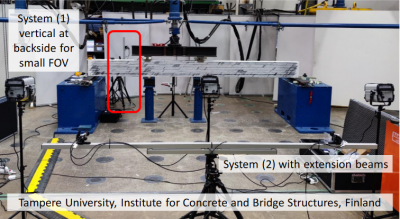 Here, opposed systems operate at different field of view ranges. Click for the high-resolution measurement of principal strain ε1 and ε2 taken from the backside.