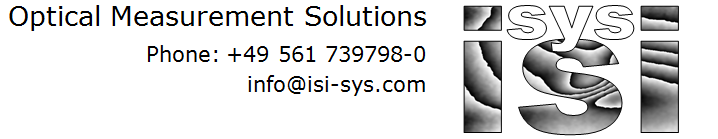
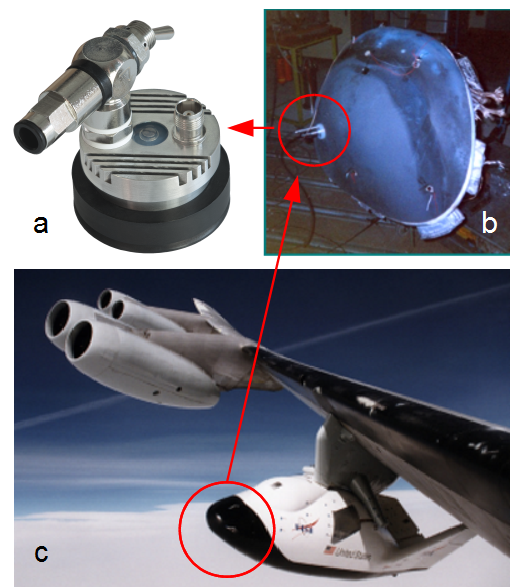
This system is used for automated, non-destructive testing of filament wound pipes. The pipes are rotated in 90° steps around their axis to monitor four circumferential segments. Two SE4 sensors with 2 x 4000 px are applied per segment along the tube axis. For a tube length of 1m @ 8000 px, this leads to 0.125 mm/px spatial pixel resolution for all 8 image segments. After inserting the pipes the ends are automatically sealed and internal pressure is used as the loading method. Since this corresponds to the usual operating load of the tubes, the measured deformation distribution visualizes mainly the relevant structural defects in contrast to other loading methods such as thermal loading.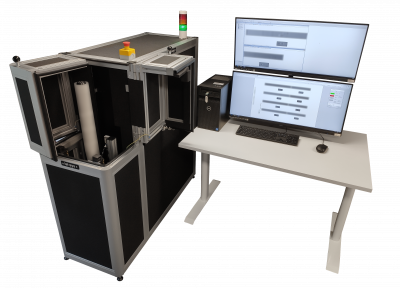
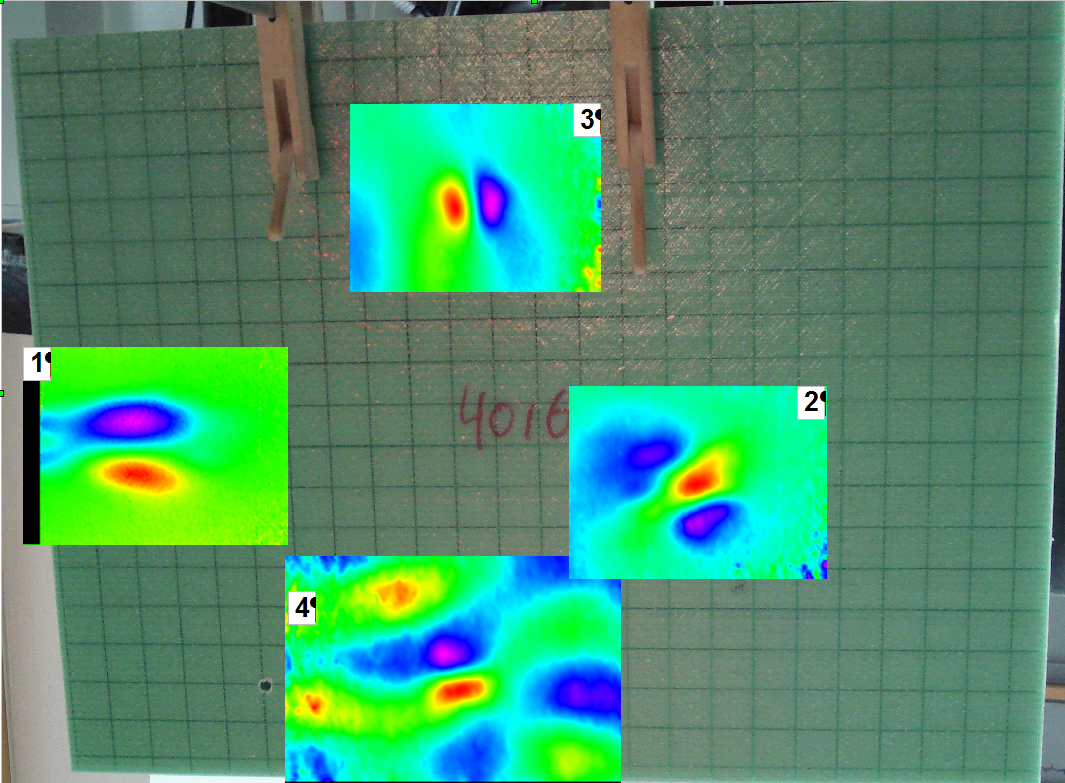
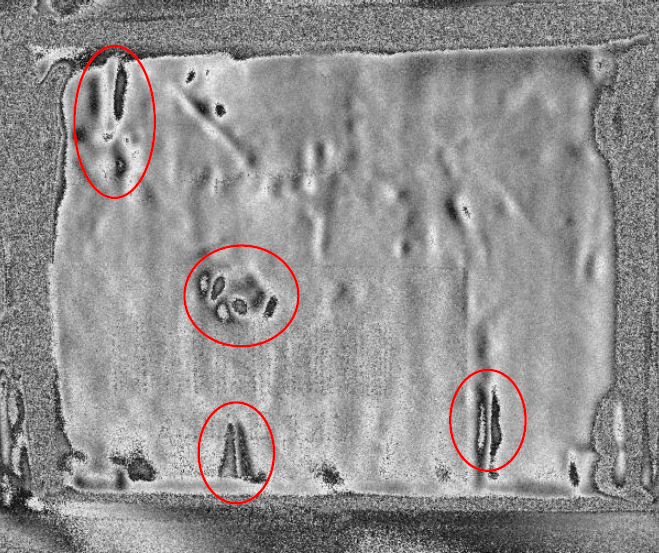
Due to the high deformation sensitivity of the SE4 sensors combined with the high spatial pixel resolution even the smallest defects can be detected. An operator finally categorizes the object as IO / NIO. Automated or AI-based image analysis is possible, but it depends on the application and detection requirements. At the end of the measurement, a report is generated and automatically stored as a PDF in a directory specified by the user.
The tubes are inserted and removed manually. An extension with collaborative robots or integration into production lines is possible. Several thousand tubes have already been tested per year without problems and maintenance.
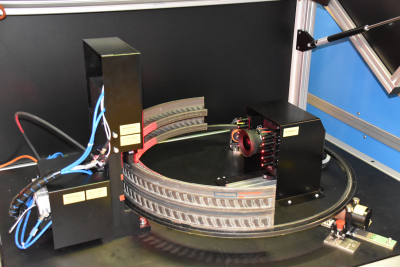
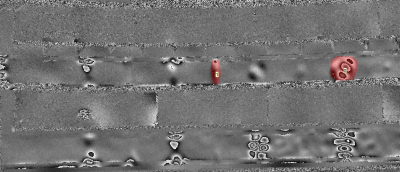
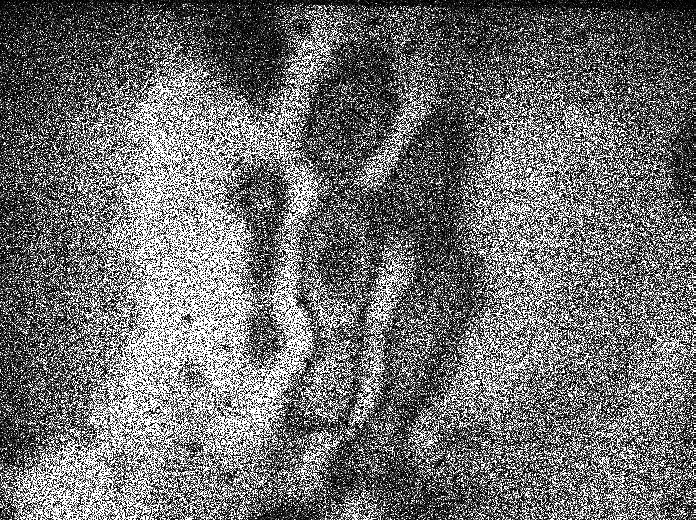
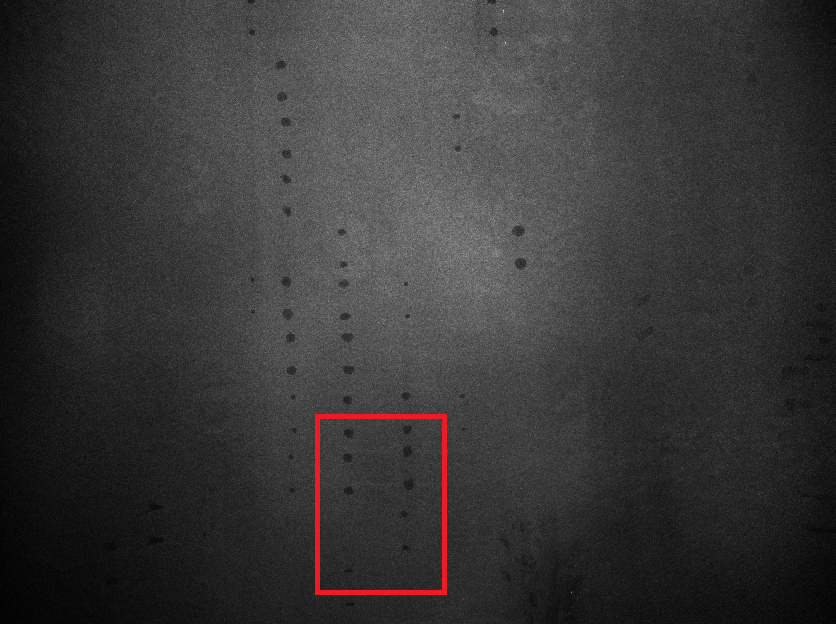
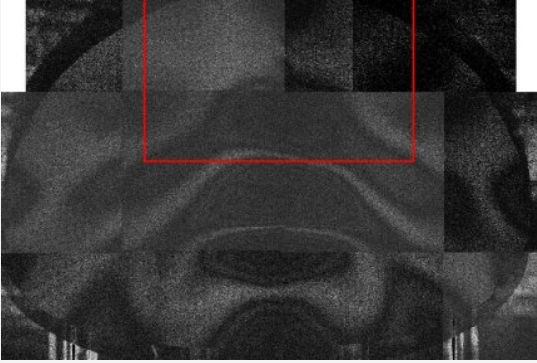
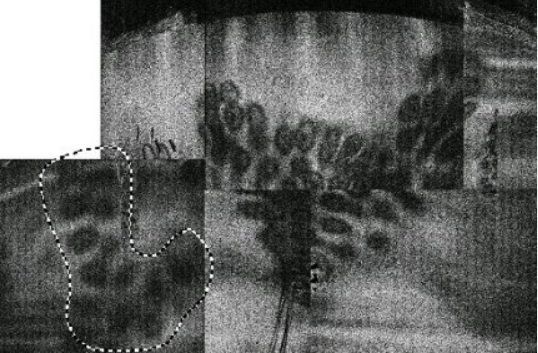
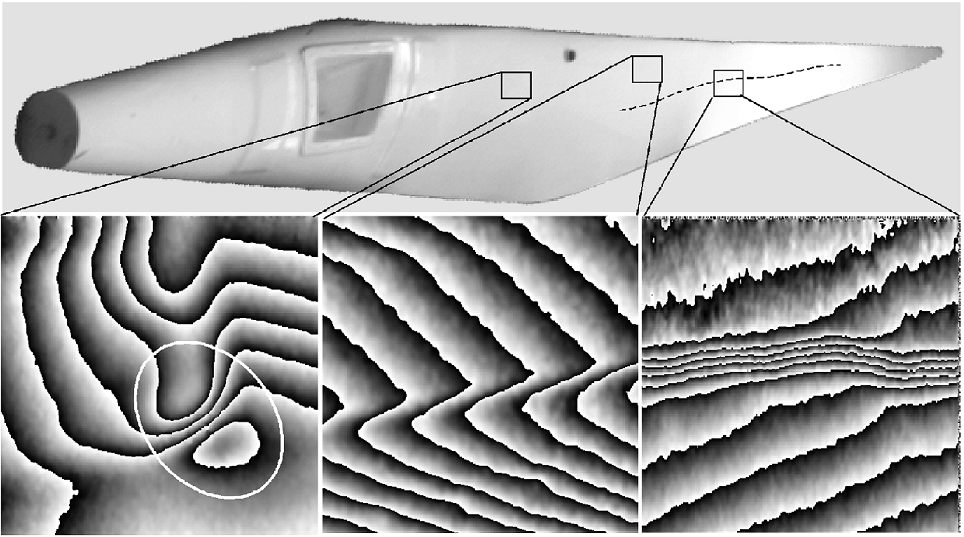
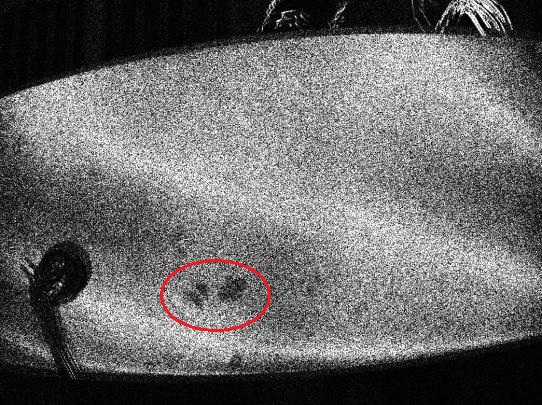
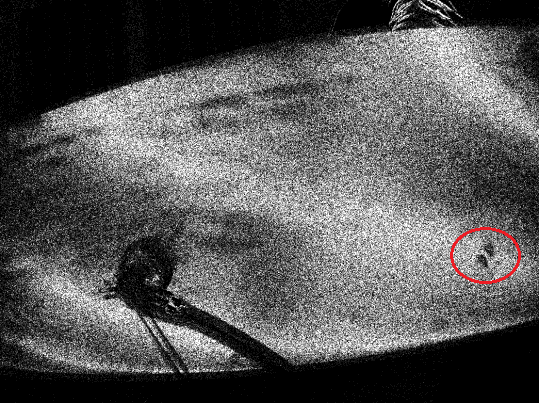
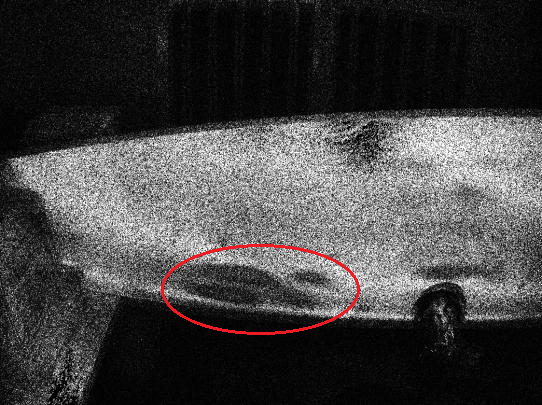
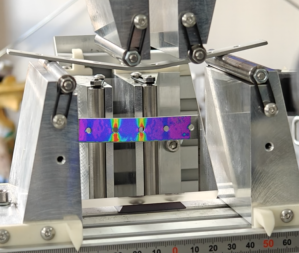
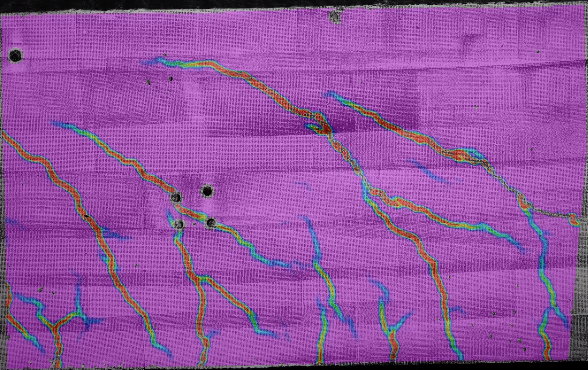
 left: Live view of surface including shearing.


