Spatial resolution and accuracy

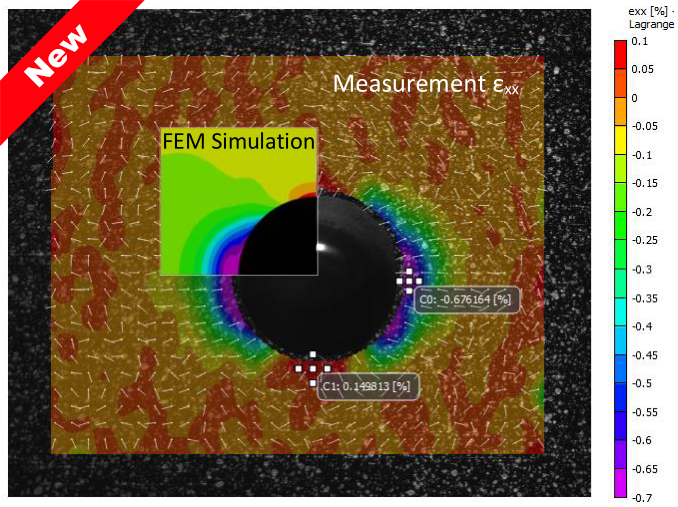
VIC-3D Pro­fes­sion­al Sys­tems deliv­er full­field, high­ly accu­rate shape, motion and defor­ma­tion mea­sure­ments. Lim­its can be traced for indi­vid­ual setups by sim­ple pro­ce­dures out­lined in the VDI-2626 direc­tive espe­cial­ly devel­oped for dig­i­tal image cor­re­la­tion (DIC). This exam­ple shows prin­ci­pal strain ε1 and ε2 (click to start video). In cas­es with local high peaks, a high spa­tial res­o­lu­tion can be the key to achiev­ing pre­ci­sion and accu­ra­cy for peak strain, in addi­tion to excel­lent SNR and cal­i­bra­tion of VIC. Video gen­er­at­ed with­in VIC iris work­space by isi-sys.


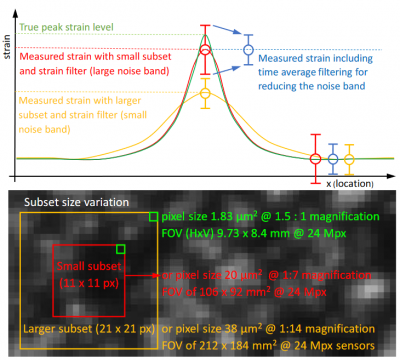
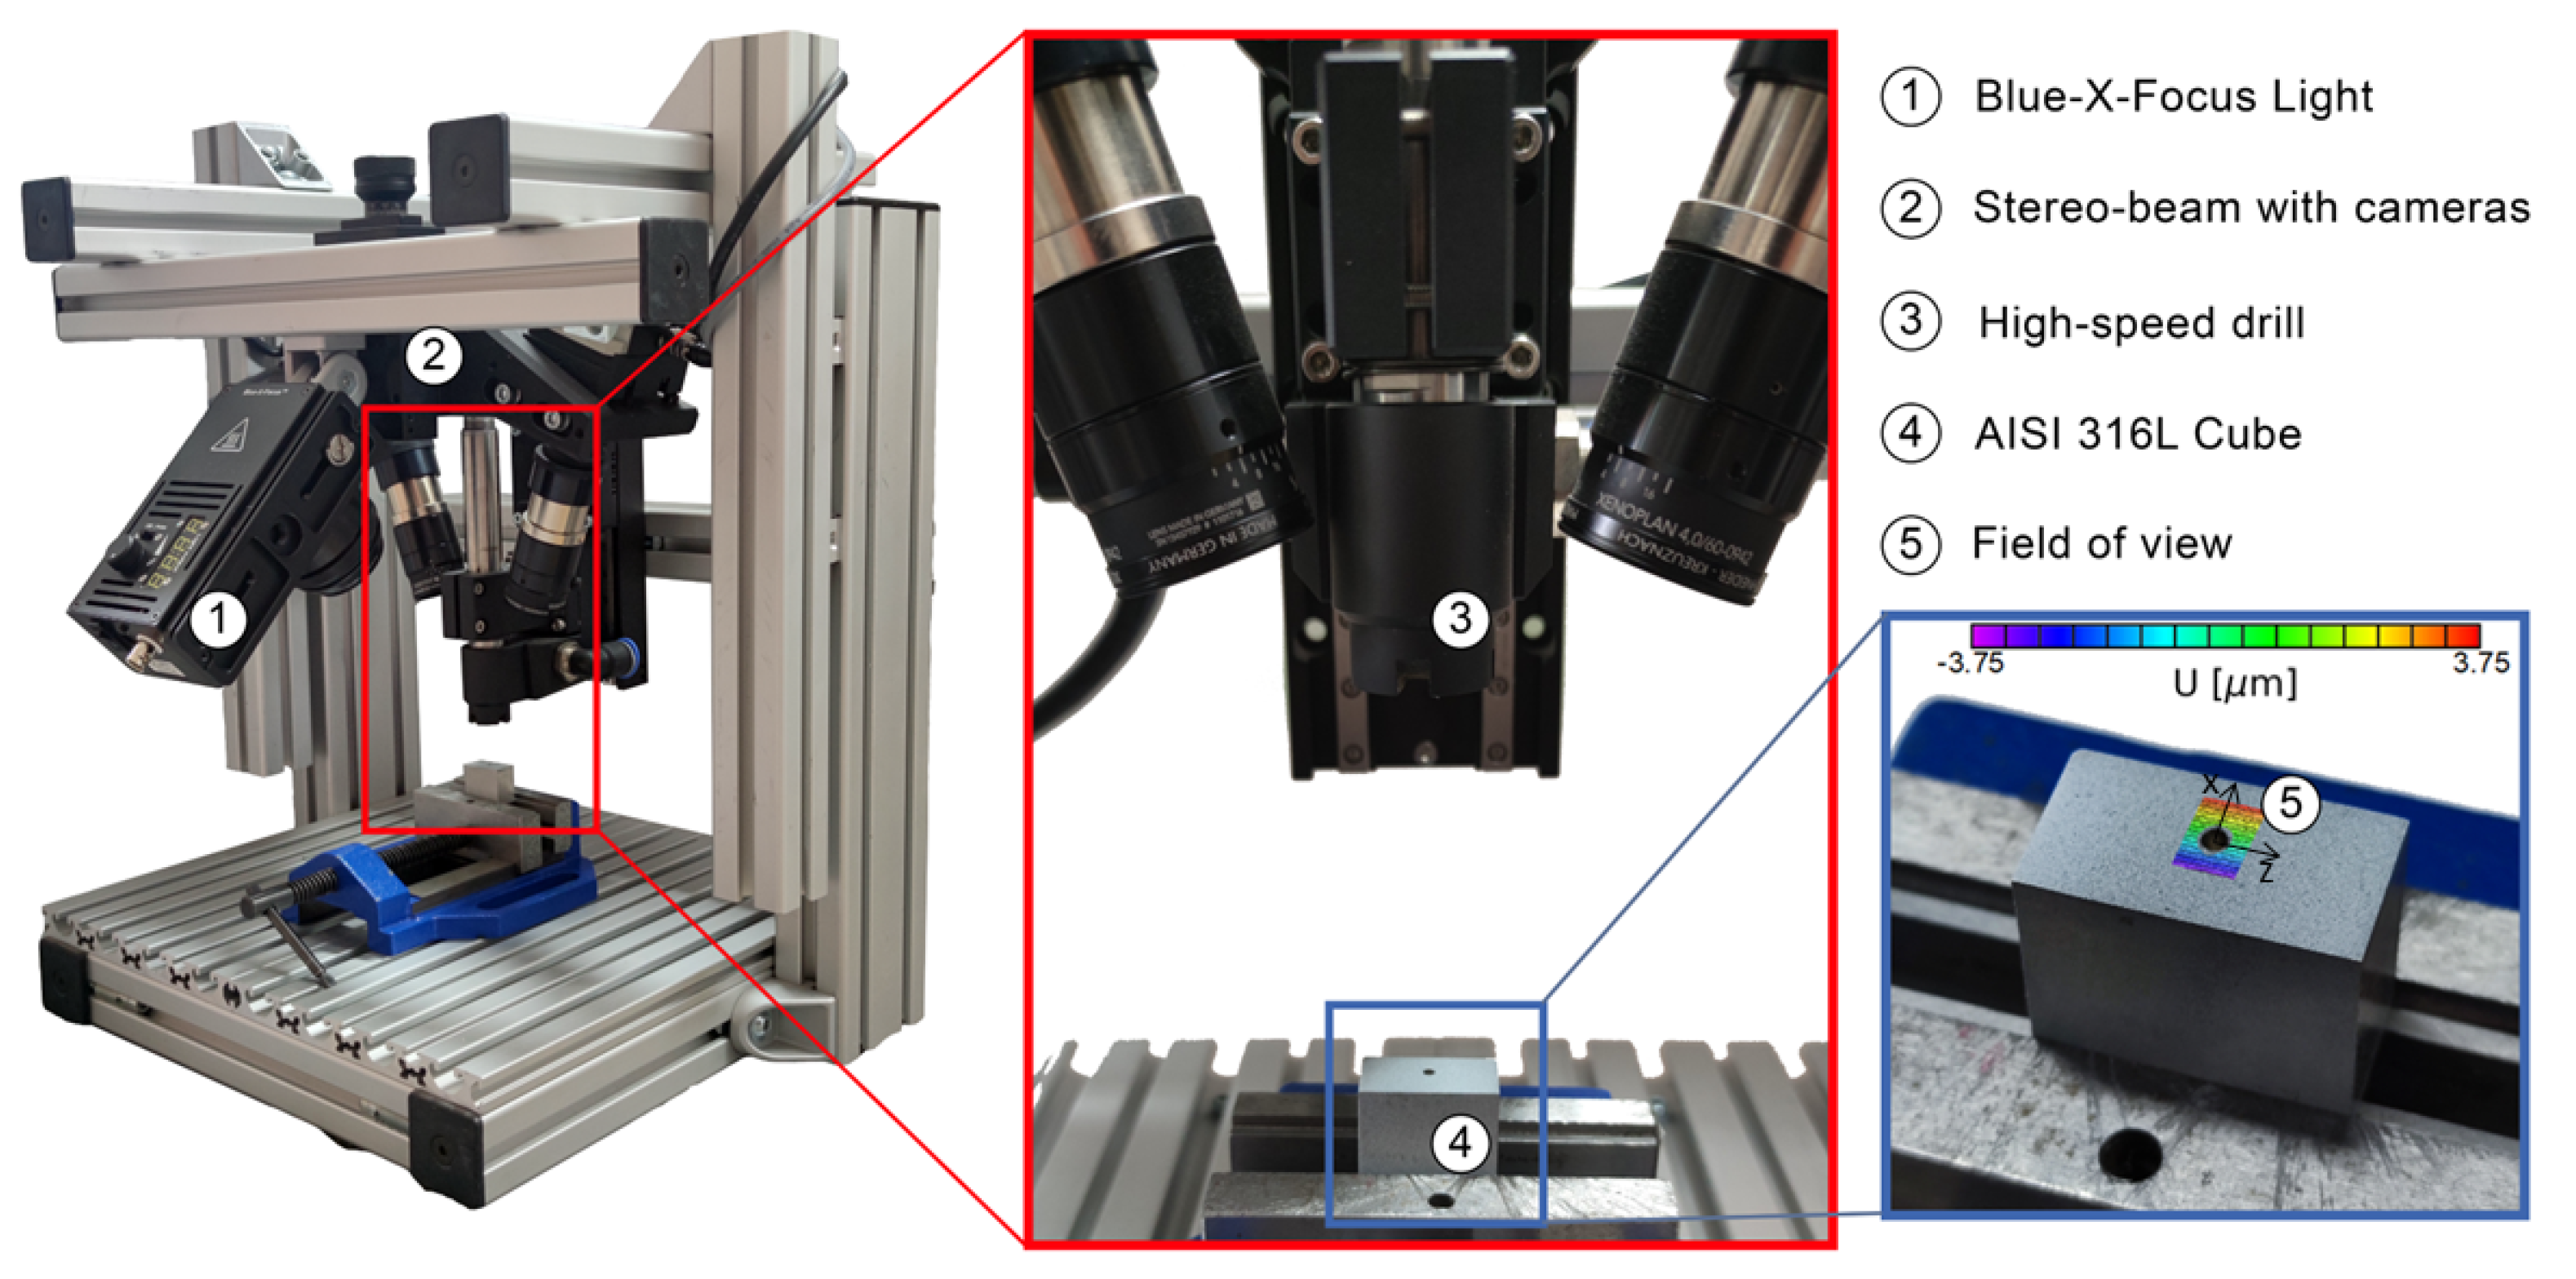
A high opti­cal res­o­lu­tion com­bined with suit­able speck­le size and den­si­ty is not only required to resolves the spa­tial strain dis­tri­b­u­tion as in the case before, but also improves accu­ra­cy in par­tic­u­lar for strain peak deter­mi­na­tion (upper right sketch), due to the fact that sub­set and strain fil­ter sizes (in pix­el scale) are fur­ther reduced (in absolute scale) com­pared to the peak strain dis­tri­b­u­tion. This fact also mat­ters for strain gauge size, as they are also not point strain mea­sure­ment device but inte­grat­ing over their length. The low­er right image is zoomed down to the pix­el  size range in VIC. It shows a high end case using the Blue-Fal­con. The lit­tle grey val­ue squares (two marked green) cor­re­sponds to the inten­si­ty val­ue of a pix­el and cov­er an area of 1.83 μm2. The vis­i­ble speck­le diam­e­ters are in the range between 3 to 8 pix­el. The red and yel­low squares also indi­cate the pix­el size oper­at­ing with larg­er FOV (mag­ni­fi­ca­tion 1:7 and 1:14), which would even not resolve speckles.


Bending Test

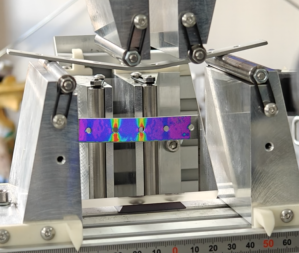
The video exam­ple shows a four point bend­ing test set­up for a met­al beam with drilled holes (side view). The beam sur­face is mea­sured by a VIC-3D Pro­fes­sion­al stereo sys­tem from below via a sur­face coat­ed mir­ror. The mea­sured prin­ci­pal strain are pro­ject­ed on the mir­rored image of the sam­ple sur­face. Mea­sure­ment of 9/2023, Uni­ver­si­ty of Lübeck.

Strain Gauge Comparison

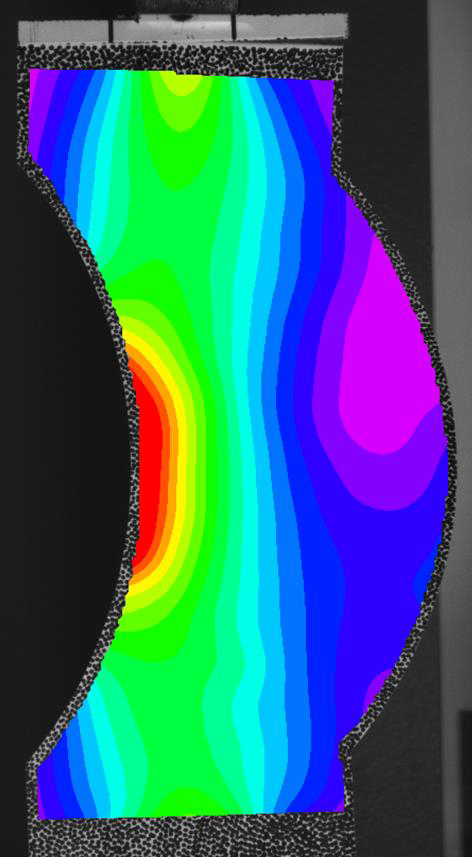
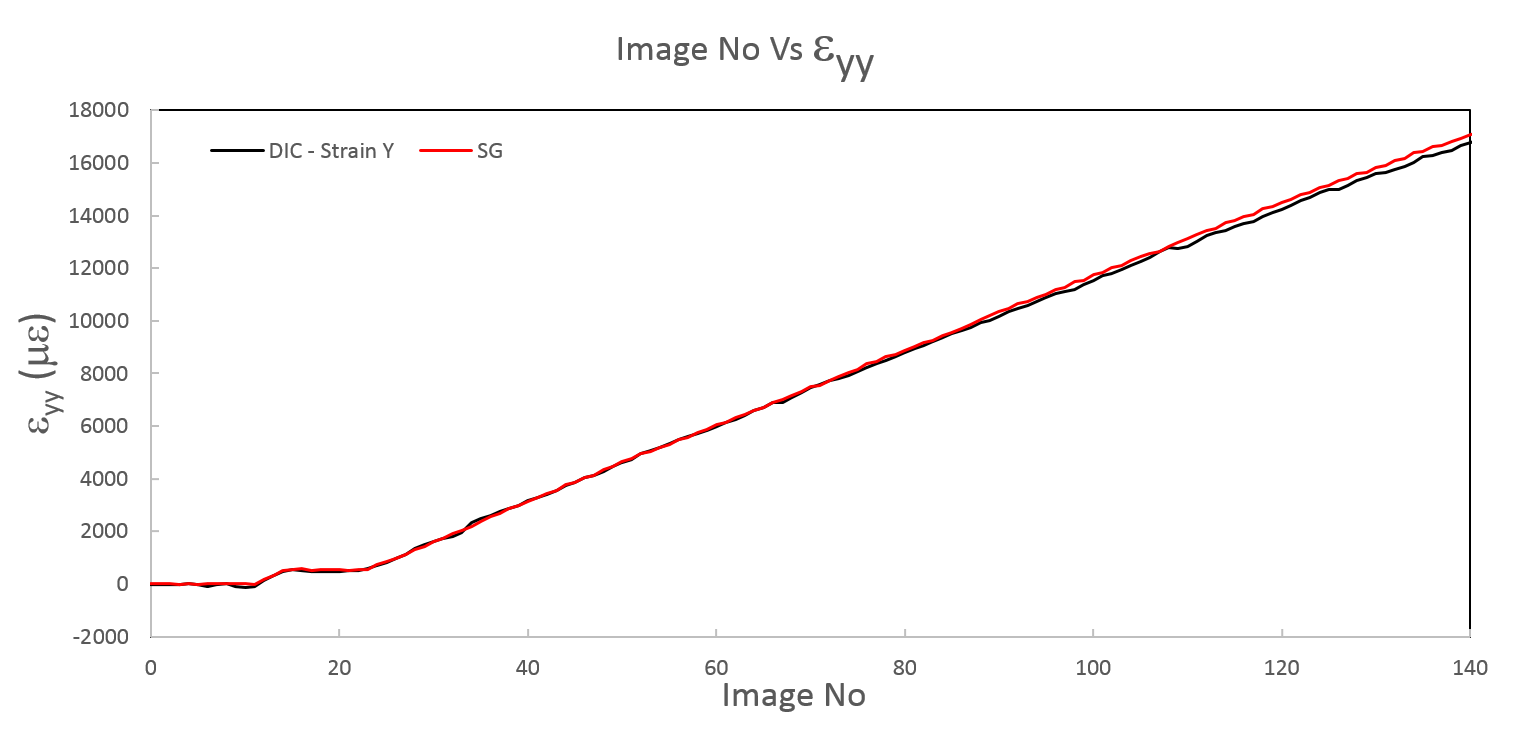
In this exam­ple a Vic-3D mea­sure­ment with 5MP CMOS Cam­era was per­formed. The acryl spec­i­men is fixed in a ten­sile test­ing machine. A strain gauge is attached at the back in com­bi­na­tion with a SCAD 500 strain gauge ampli­fi­er. The out­put of the SCAD 500 was con­nect­ed to the DAQ of the DIC sys­tem. The strain results are record­ed par­al­lel with the Vic-3D mea­sure­ment and plot­ted in a dia­gram. The cam­era type is equipped with Sony 5Mpx Pregius sen­sor, 75 fps.

Strain Gauge Comparison-1  Strain Gauge Comparison-1a

Image 1: Vic-3D mea­sure­ment of the acryl specimen


Strain Gauge Comparison-2


Image 2: Com­par­i­son of strain gauge data (red curve) and DIC Strain data (black curve)


The Vic-3D data match near­ly per­fect with the strain gauge data. Even at low strains the dif­fer­ence is less than 25 micro strain.

Strain Measurement on a Gearwheel

Challenges

Assem­bled com­po­nents typ­i­cal­ly have com­plex inter­ac­tions with one anoth­er. Con­tact points can vary dur­ing oper­a­tional cycles due to part move­ment. This means that the loca­tions of peak strains can be hard to pre­dict, and they are often not sta­tion­ary. The move­ment of parts can also make it imprac­ti­cal to main­tain elec­tri­cal con­nec­tions with gauges. Even when they are sta­tion­ary and easy to locate, the high­est strains can be con­cen­trat­ed in very small areas or have high gra­di­ents. Peak val­ues may be lost to the aver­ag­ing effect pro­duced by gauges.


Solution

Vic-3D pro­vid­ed a means for mak­ing strain mea­sure­ments across the entire pro­file of the gear tooth. Because it pro­vides full-field mea­sure­ments, it was not nec­es­sary to choose a par­tic­u­lar point at which mea­sure­ments would be made. This allowed the peak strains to be clear­ly visu­al­ized and accu­rate­ly mea­sured at var­i­ous stages of the oper­a­tional cycle. Vic-3D also mea­sured dis­place­ment in three dimen­sions. This fea­ture allowed our cus­tomer to rec­og­nize and quan­ti­fy twist­ing of the gear tooth under load.

Microscopic Strain Measurement

Combination of a special stereomicroscope with Vic-3D digital image correlation on electronic components.


Uni Wien Mikroskop

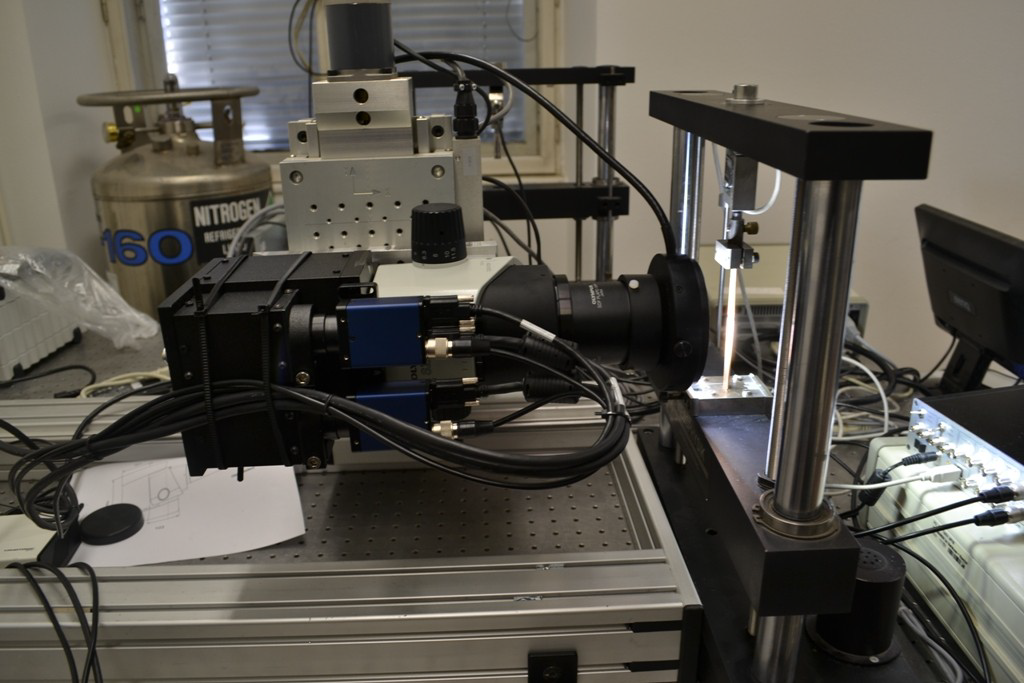
Mea­sure­ment set up: Stereo micro­scope mounted

on x‑y-z-microtable (back­side) and ten­sile machine (right).


Uni Wien Mikroskop2

Uni Wien Mikroskop3

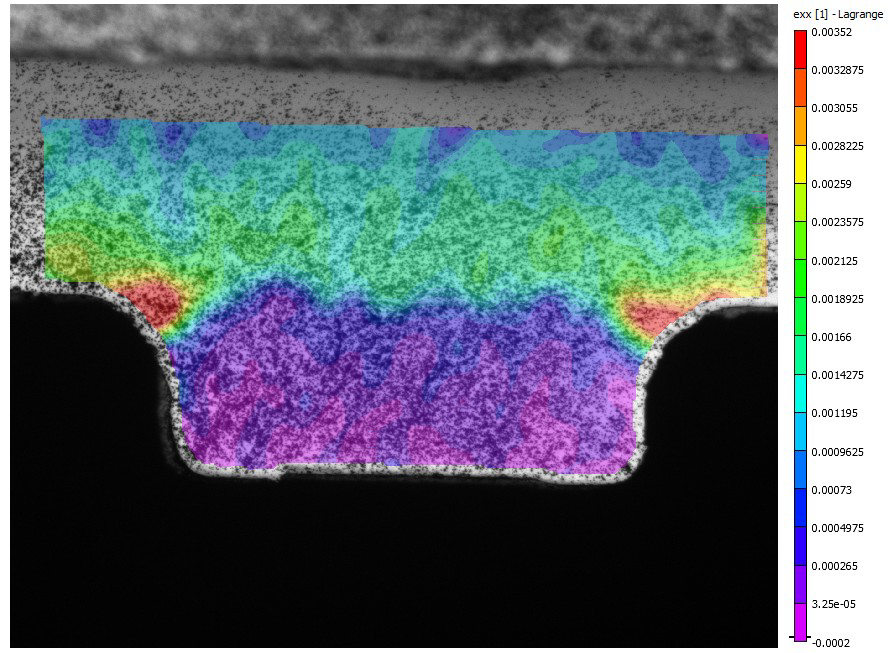
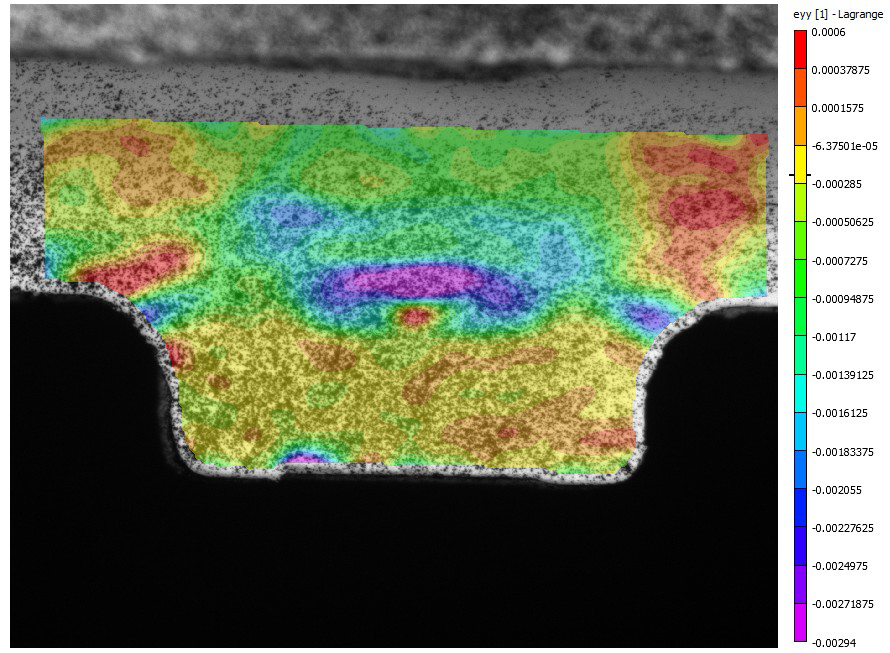
Servered ceram­ic capac­i­tor chip under bend­ing load (image width approx. 4mm):
Strain in x‑direction (upper image) and y- direc­tion (low­er image).


Uni Wien Mikroskop4

Uni Wien Mikroskop5

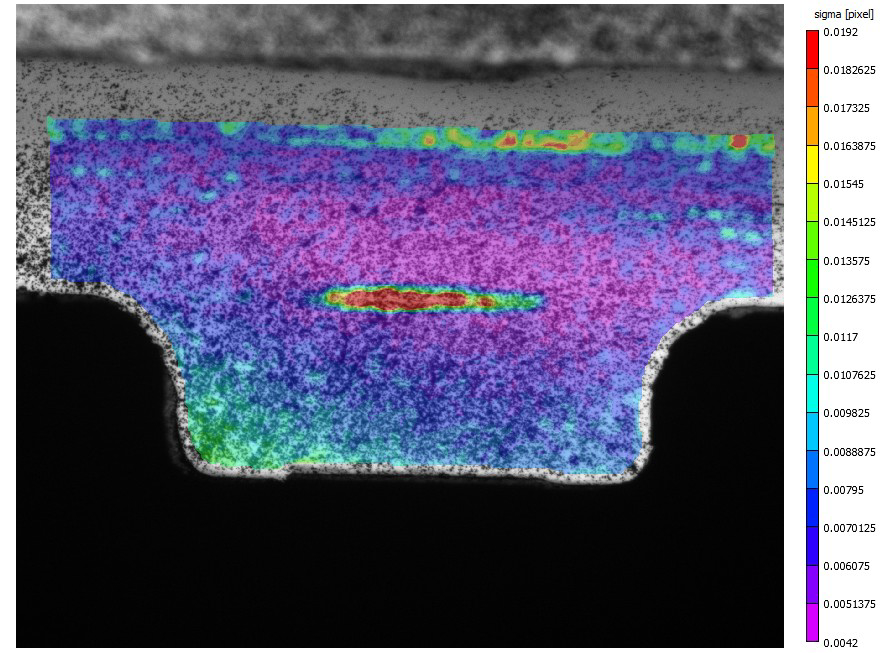
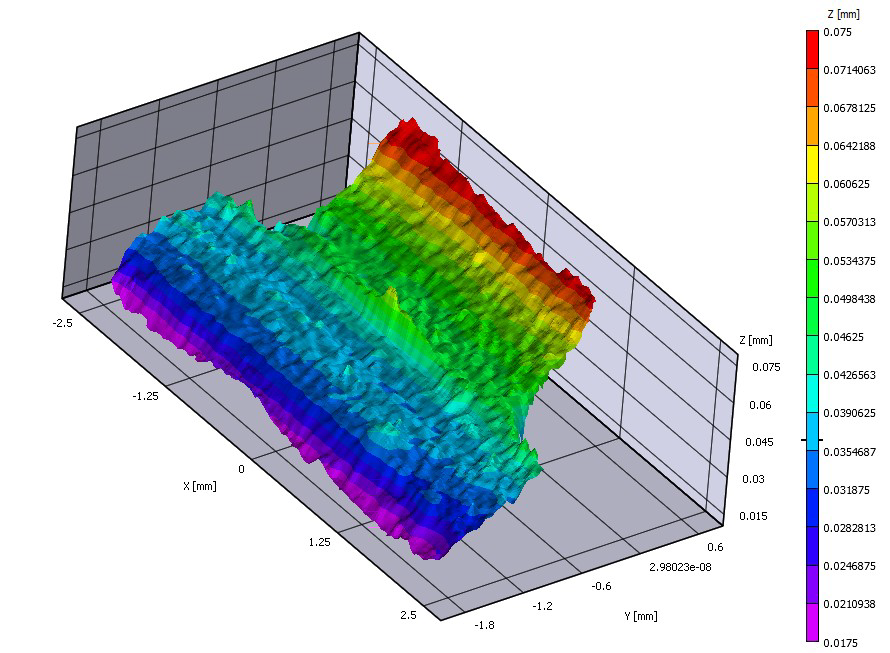
Stan­dard deriva­tion (upper) under load : An increased val­ue occurs on the mid­dle against the reference
state by the local­ly small bulge at the con­tact between chip and board (see 3D con­ture below). This might be caused
by mate­r­i­al , which is pressed togeth­er between the two parts (includ­ing the colour lay­er). In the upper area the
increased val­ues of the stan­dard deriva­tion is caused by the reduced speck­le density.


Vic-3D High-Speed Vibration Analysis System

Vibration1               Vibration2


The Vic-3D™ Vibra­tion Analy­sis Sys­tem by Cor­re­lat­ed Solu­tions, Inc. is a new addi­tion to the Vic-3D prod­uct line of mea­sure­ment solu­tions. Vic-3D Vibra­tion enables full-field 3D view­ing, mea­sure­ment, and analy­sis of tran­sient events. Full-field oper­a­tional deflec­tion shapes in the fre­quen­cy domain can eas­i­ly be seen and com­pared with lev­els of accu­ra­cy in the nanome­ter range.

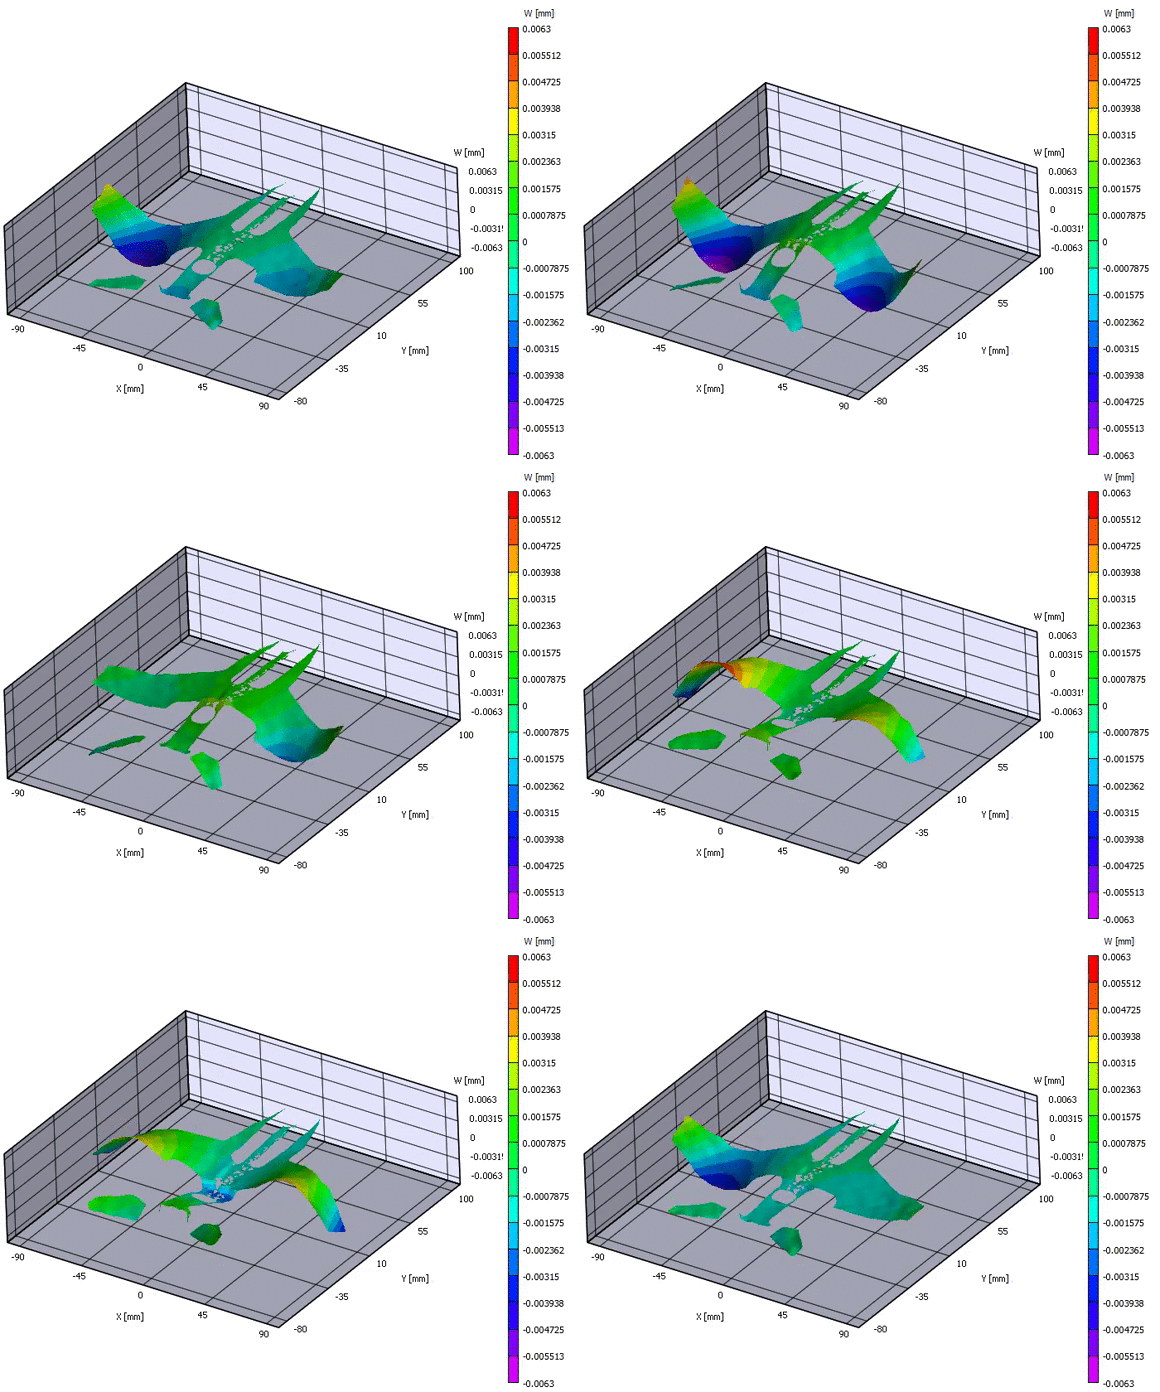
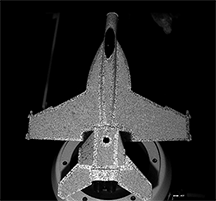
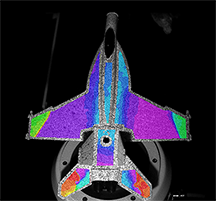
The image above on the left is a mount­ed mod­el jet plane which has under­gone a tran­sient vibra­tion event.  To the right, the 3D vibra­tion data obtained from the event is shown as a 2D con­tour over­lay on this image.  The data over­lay enables the user to see exact­ly how much defor­ma­tion is occur­ring and where it is occur­ring.  This infor­ma­tion is avail­able at each fre­quen­cy where deflec­tion shapes occur.

The data below dis­plays one oper­a­tional deflec­tion shape obtained with the VIC-3D Vibra­tion Analy­sis Sys­tem. Three-dimen­sion­al dis­place­ments, strains, veloc­i­ties, and accel­er­a­tions can all be com­put­ed in the analy­sis soft­ware.  The result is not only visu­al, but also enables the user to export quan­ti­ta­tive data (ASCII, Mat­Lab, CSV, etc.) from the sample’s behav­ior for FEA analy­sis and val­i­da­tion.  A 3D ani­ma­tion of the mod­el jet’s oper­a­tional deflec­tion shape at 441 Hz is shown below, with only 12 microns of dis­place­ment amplitude.


Film Vibration3D_W_431Hz


What is transient vibration analysis? 

Tran­sient vibra­tion analy­sis is the process of mon­i­tor­ing, mea­sur­ing, and ana­lyz­ing the con­di­tion of sam­ples dur­ing a tran­sient event. Mate­r­i­al prop­er­ties can also be observed through the analy­sis of oper­a­tional deflec­tion shapes and mode shapes cre­at­ed by the event. These full-field 3D shapes can pro­vide use­ful infor­ma­tion which can be used to improve and cor­rect a sample’s bal­ance, dis­place­ment, flex­ure, rigid­i­ty, and over­all prod­uct per­for­mance.  Mea­sur­ing oper­a­tional deflec­tion shapes can help answer the ques­tion: “How much is this struc­ture actu­al­ly mov­ing at a par­tic­u­lar frequency?”


Why is it important to you?

Oper­a­tional deflec­tion shapes cre­at­ed from tran­sient tests show how a sam­ple can have a nonuni­form thick­ness­es, sur­face irreg­u­lar­i­ties, weak points, cracks and/or oth­er imper­fec­tions & flaws.  This infor­ma­tion can be use­ful at any point in the process of achiev­ing your over­all goal, from writ­ing a project pro­pos­al to test­ing a func­tion­al or fail­ing part in the field: The Vic-3D Vibra­tion Analy­sis Sys­tem

  • Has a jus­ti­fi­able price point when writ­ing proposals
  • Can be used: 
    • To cre­ate and val­i­date FE mod­els when design­ing parts & equipment
    • Dur­ing the research and design process
    • In the prod­uct test­ing phase
    • To pro­vide man­u­fac­tur­ing qual­i­ty assurance
    • To cer­ti­fy and assure equip­ment is oper­at­ing as expect­ed and required
    • To mea­sure and ana­lyze parts post-installation
    • To ensure prod­uct qual­i­ty and per­for­mance over time and in the field
    • When reassess­ing prod­uct func­tion­al­i­ty over time


Exam­ples of tran­sient events which can be mea­sured are the following:

▪ Door Slams ▪ Modal Ham­mer Strikes
▪ Engine Start-ups ▪ Drop Tests
▪ Explo­sive Testing ▪ Bal­lis­tic Testing


System Features 

  • View, com­pare, ani­mate, graph, extract, and export data for easy FEA comparison
  • Mea­sure 3D full-field, high fre­quen­cy mode shapes with nanome­ter resolution
  • Mea­sure extreme­ly low ampli­tudes with extreme­ly high accelerations
  • Full-field strain, defor­ma­tion, and shape vari­ables are still available
  • Easy pro­ce­dures, accu­rate results
  • User friend­ly interface
  • Only a frac­tion of the price of a laser vibrom­e­ter system


Advantages over other measurement techniques

While tra­di­tion­al vibra­tion mea­sure­ment tech­niques can be use­ful, they also have many draw­backs.  For exam­ple, accelerom­e­ters can become unglued dur­ing test­ing, can mass-load a sam­ple, and can only pro­vide point to point mea­sure­ments, often only in a sin­gle plane. Pre-test­ing and test­ing can also take days or even weeks to per­form on large struc­tures.  With the Vic-3D Vibra­tion Analy­sis sys­tem, there are no adhe­sives, wires, sig­nal ana­lyz­ers, pow­er ampli­fiers, or load cells nec­es­sary for detailed vibra­tion results.  Obtain­ing thou­sands of data points for a tiny, com­plex struc­ture or a large one is as easy as chang­ing a pair of lens­es. Sim­i­lar to dig­i­tal image cor­re­la­tion, laser vibrom­e­ters can pro­vide a non-con­tact mea­sure­ment solu­tion, but sim­i­lar to accelerom­e­ters, they are also only able pro­vide point to point mea­sure­ments.  A 3D mea­sure­ment can be achieved with mul­ti­ple scan­ning vibrom­e­ters, but these are usu­al­ly mount­ed on large robot arms which can take up valu­able lab­o­ra­to­ry space and can­not be moved eas­i­ly once installed.  Addi­tion­al­ly, these sys­tems are unrea­son­ably expen­sive for many appli­ca­tions.  The Vic-3D Vibra­tion Analy­sis sys­tem can be tak­en into the field with any com­pat­i­ble lap­top and togeth­er with the Vic-3D Work­sta­tion, the sys­tem can become mobile and secure inside your facil­i­ty.  Vic-3D Vibra­tion Analy­sis is only a frac­tion of the price of a 3D scan­ning laser vibrom­e­ter sys­tem, and since the mod­ule can be added onto any exist­ing 3D sys­tem, it’s even more affordable.