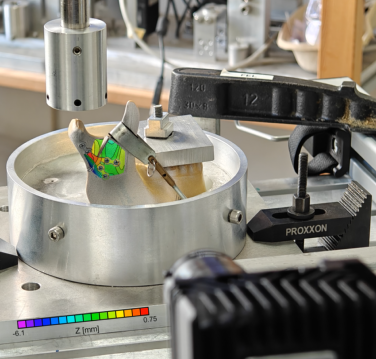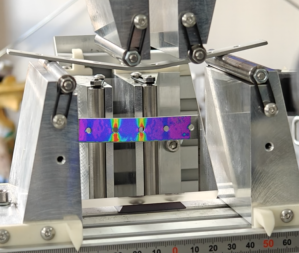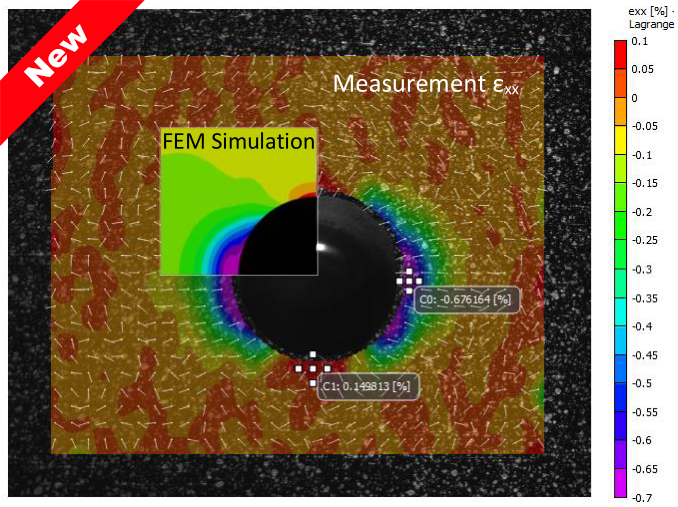
Results of a 2D fartigue test on a thick piece of notched steel. With the use of a 2,3MP camera and Vic-2D a high strain resolution of approximate 5–10 microstrain can be archieved.
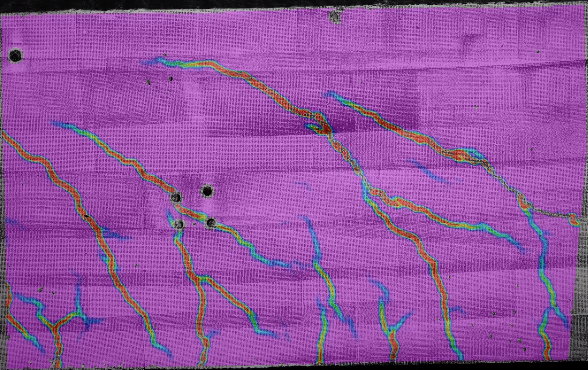
The video shows the results of this fartigue test.
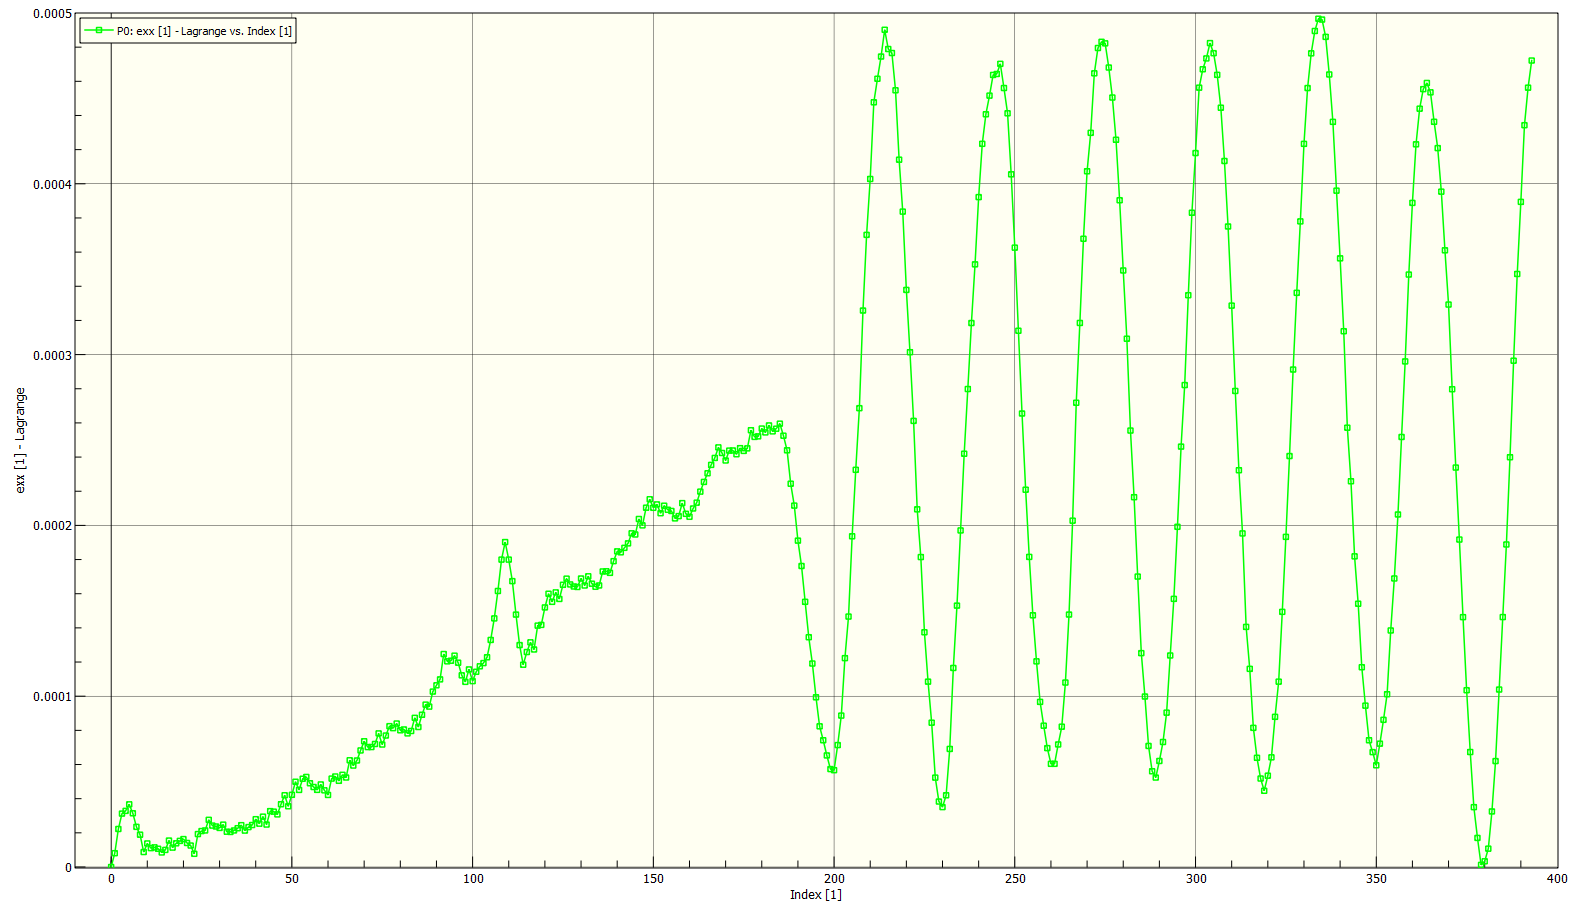
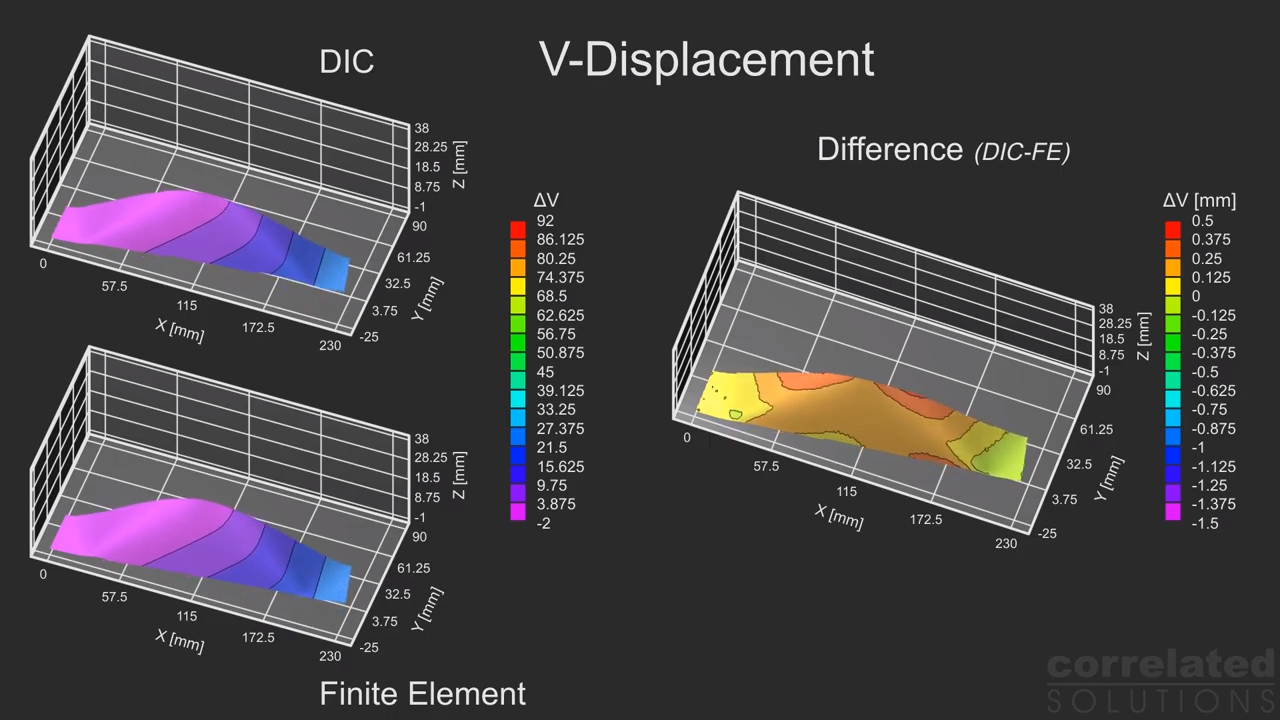
The graph demonstrates the bending load over time.