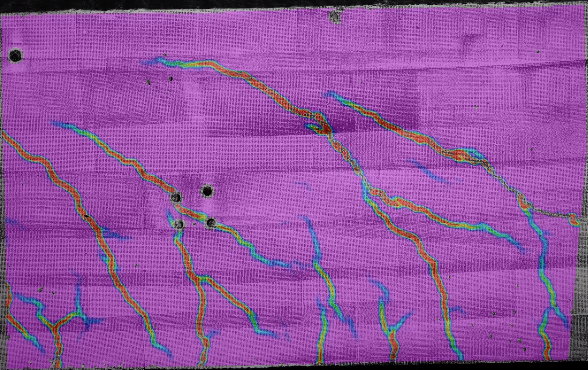
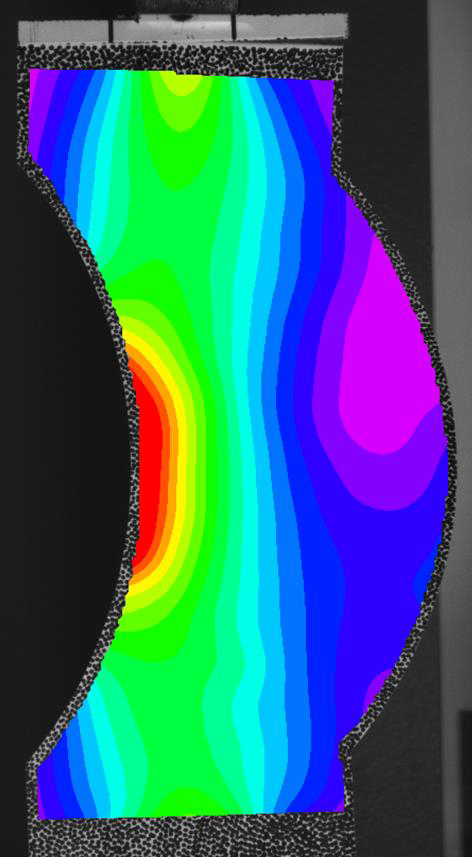
VIC-3D Professional Systems deliver fullfield, highly accurate shape, motion and deformation measurements. Limits can be traced for individual setups by simple procedures outlined in the VDI-2626 directive especially developed for digital image correlation (DIC). This example shows principal strain ε1 and ε2 (click to start video). In cases with local high peaks, a high spatial resolution can be the key to achieving precision and accuracy for peak strain, in addition to excellent SNR and calibration of VIC. Video generated within VIC iris workspace by isi-sys.
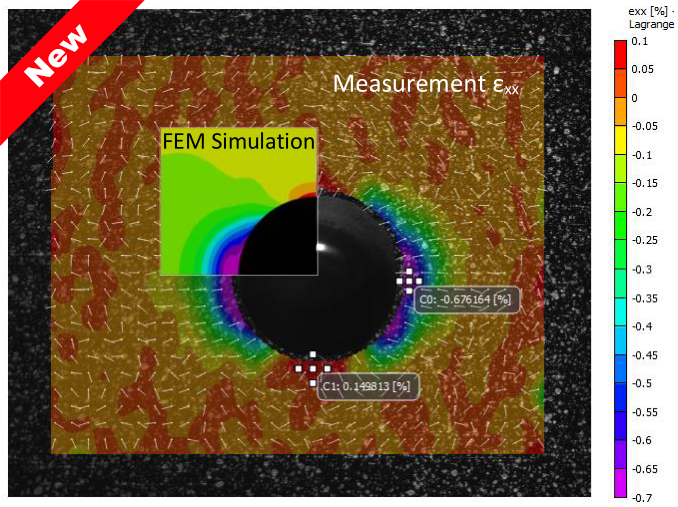
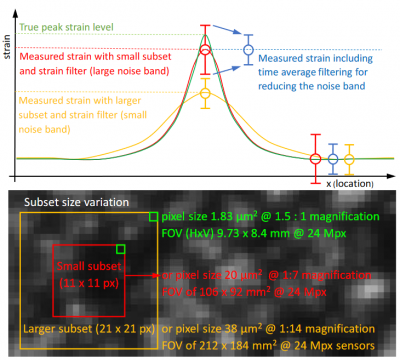
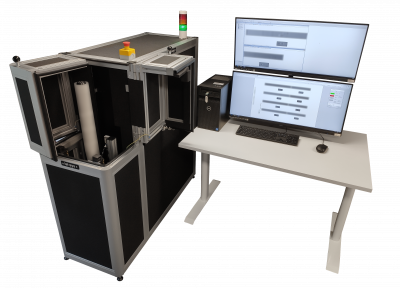
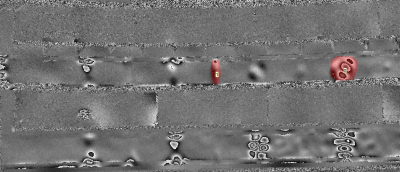
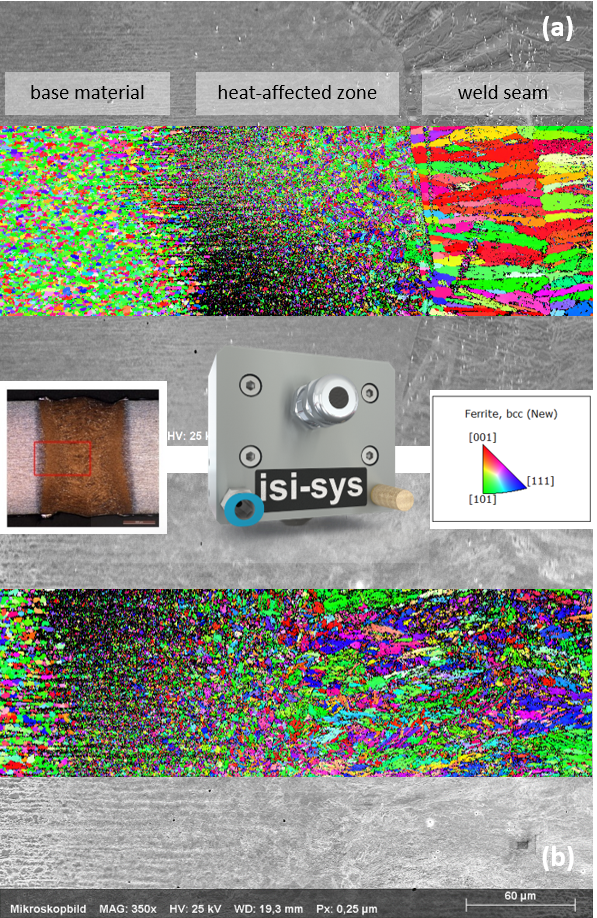
A high optical resolution combined with suitable speckle size and density is not only required to resolves the spatial strain distribution as in the case before, but also improves accuracy in particular for strain peak determination (upper right sketch), due to the fact that subset and strain filter sizes (in pixel scale) are further reduced (in absolute scale) compared to the peak strain distribution. This fact also matters for strain gauge size, as they are also not point strain measurement device but integrating over their length. The lower right image is zoomed down to the pixel size range in VIC. It shows a high end case using the Blue-Falcon. The little grey value squares (two marked green) corresponds to the intensity value of a pixel and cover an area of 1.83 μm2. The visible speckle diameters are in the range between 3 to 8 pixel. The red and yellow squares also indicate the pixel size operating with larger FOV (magnification 1:7 and 1:14), which would even not resolve speckles.
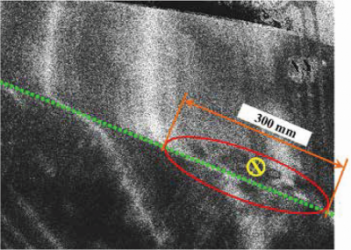
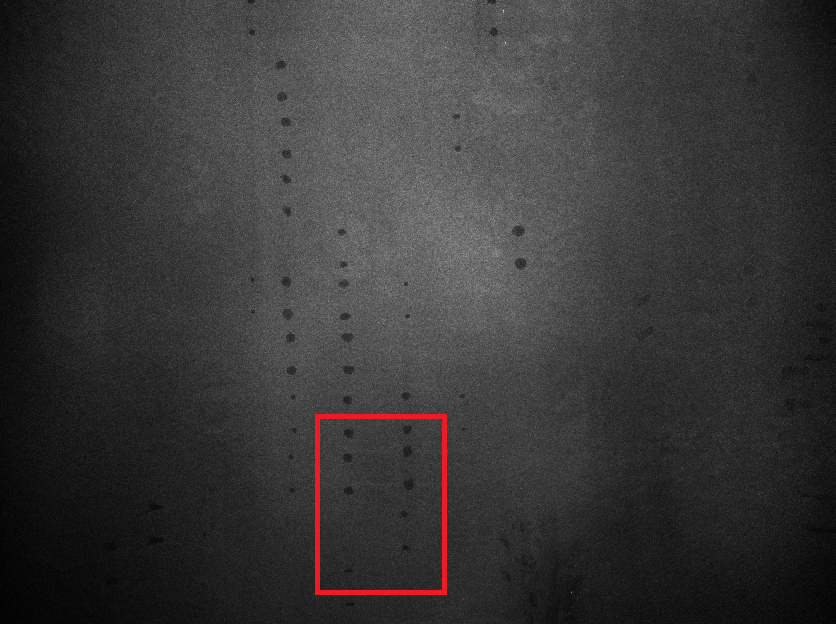
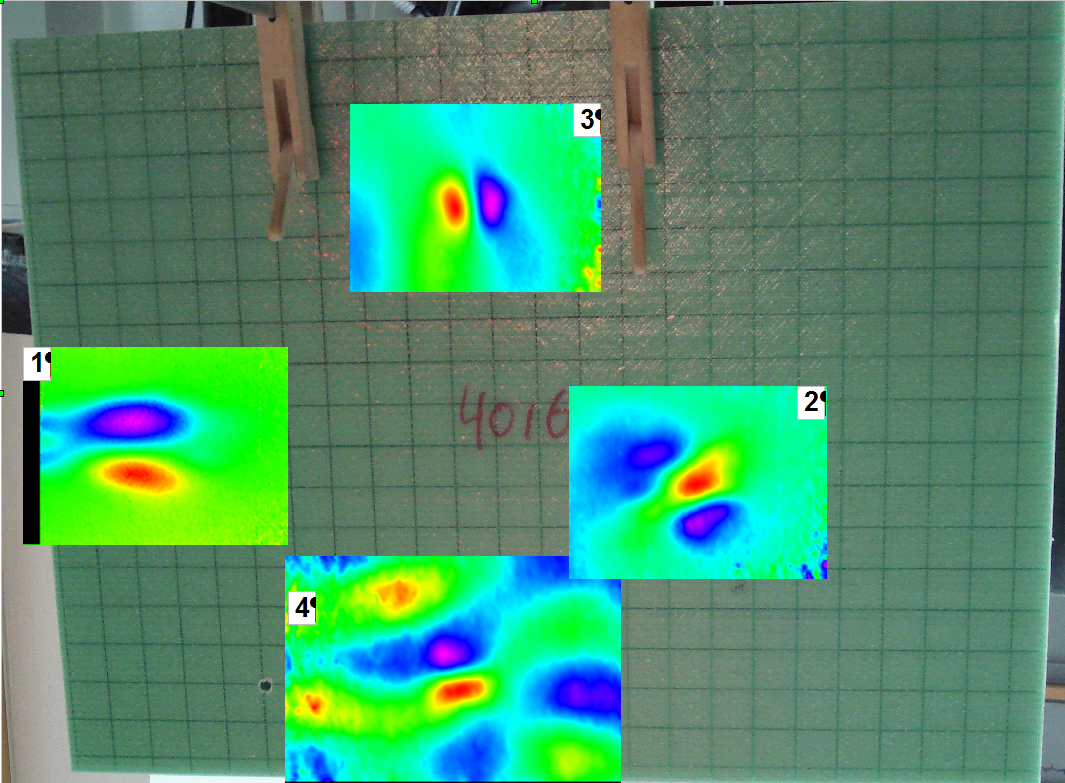
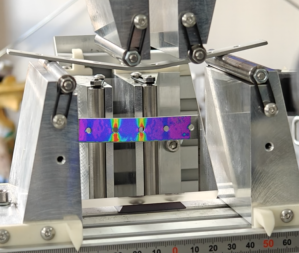
 left: Live view of surface including shearing.