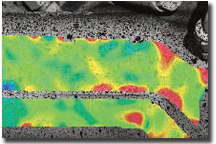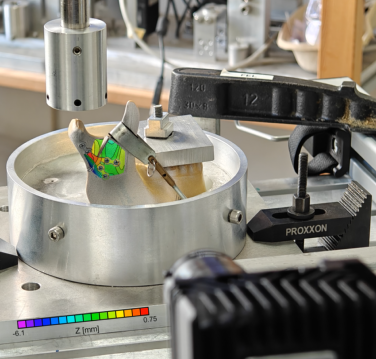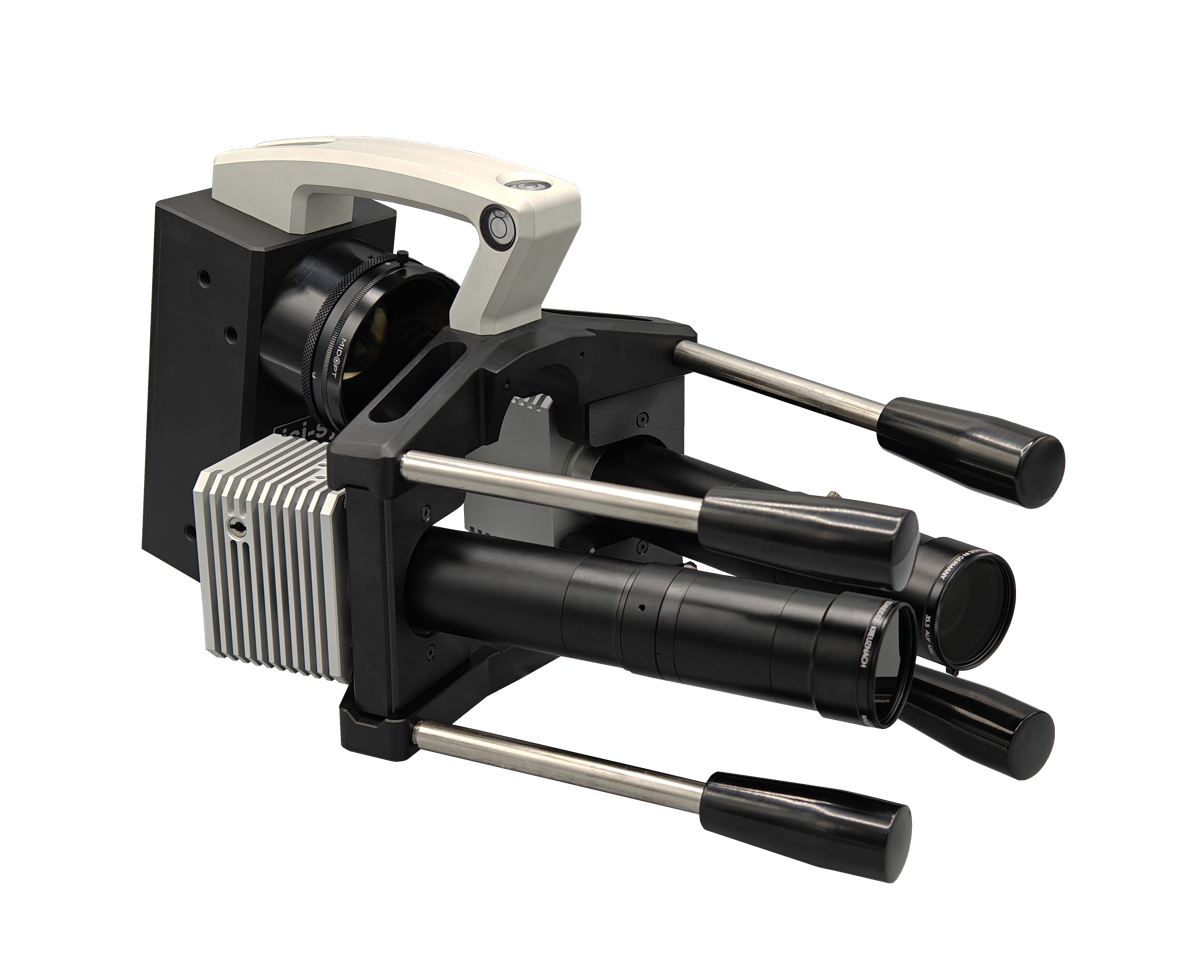
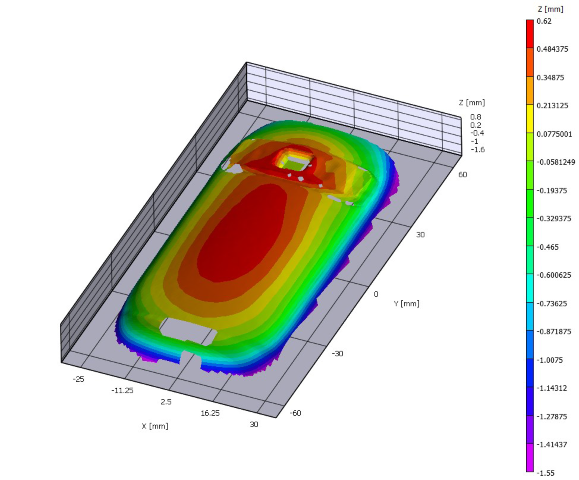
Air inclusion or air pockets in modern Li-battery packs is a serious and dangerous problem. The isi-sys SE2 sensor is able to detect tiny and large defects such as air bubbles, air pockets, cracks and other within a second. The defects can be far below or near to the surface. An example of a battery pack (test sample from University of Munich, IWB) and the measurement result is shown below.
Test setup:
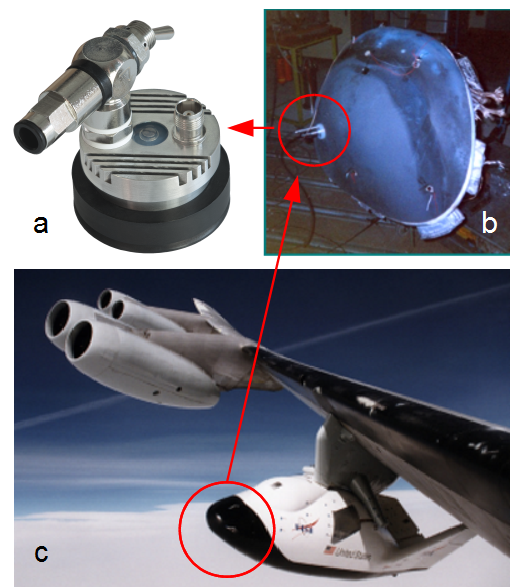
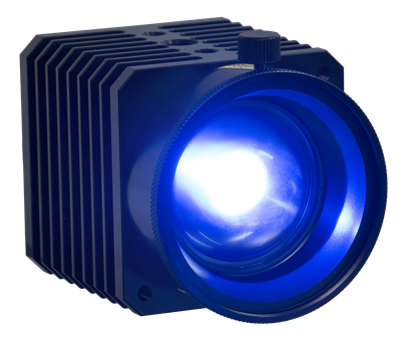
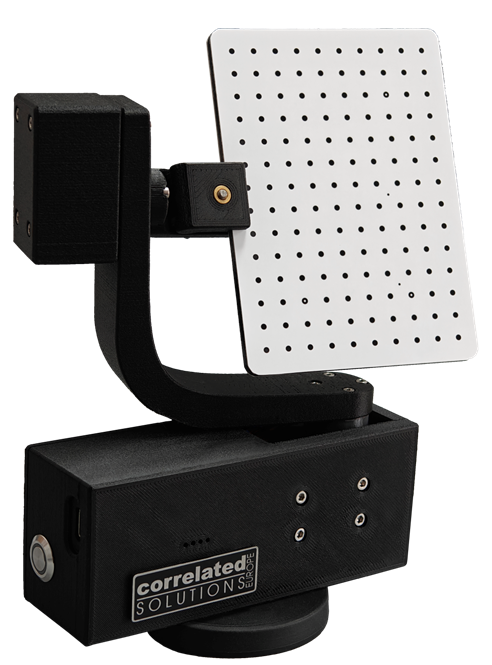
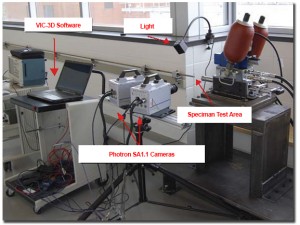
The test has been done by SE2 sensor in combination with a glass vacuum chamber for a simple manual test. This is an economic solution for spot NDT by manual service. For automated series test in production different setups are required.
Test pocedure:
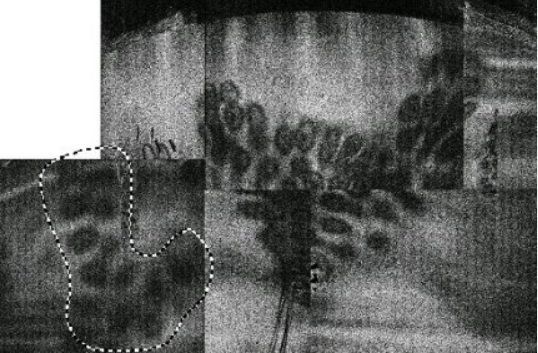
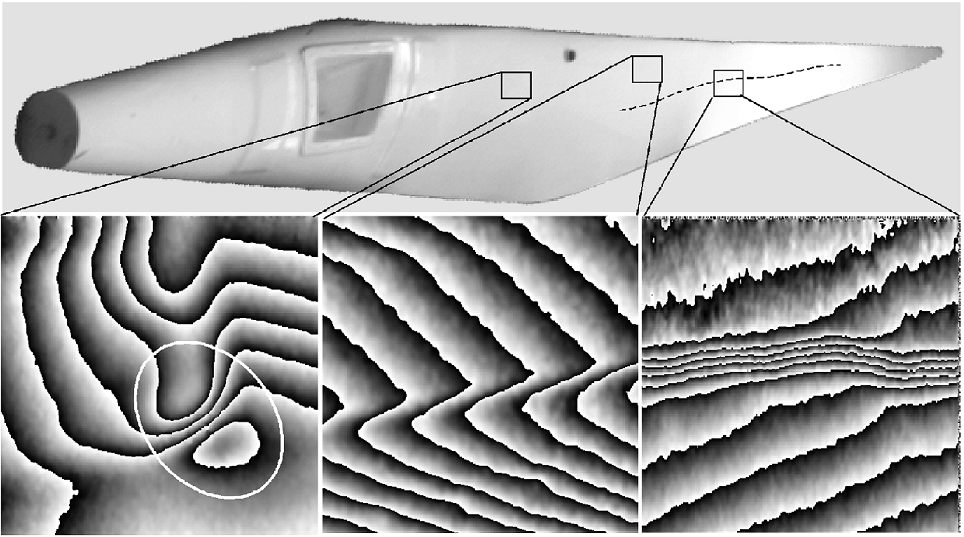
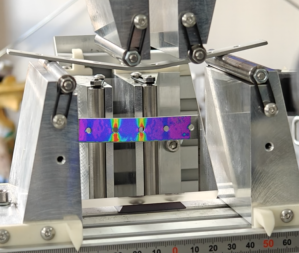
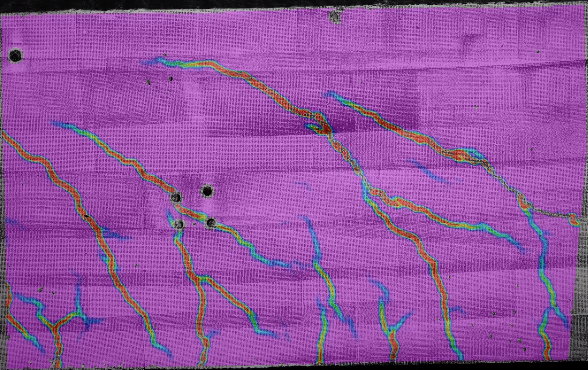
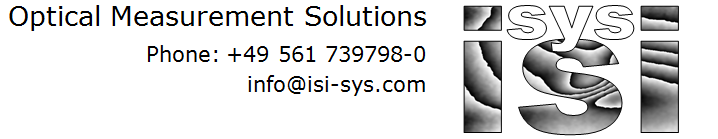
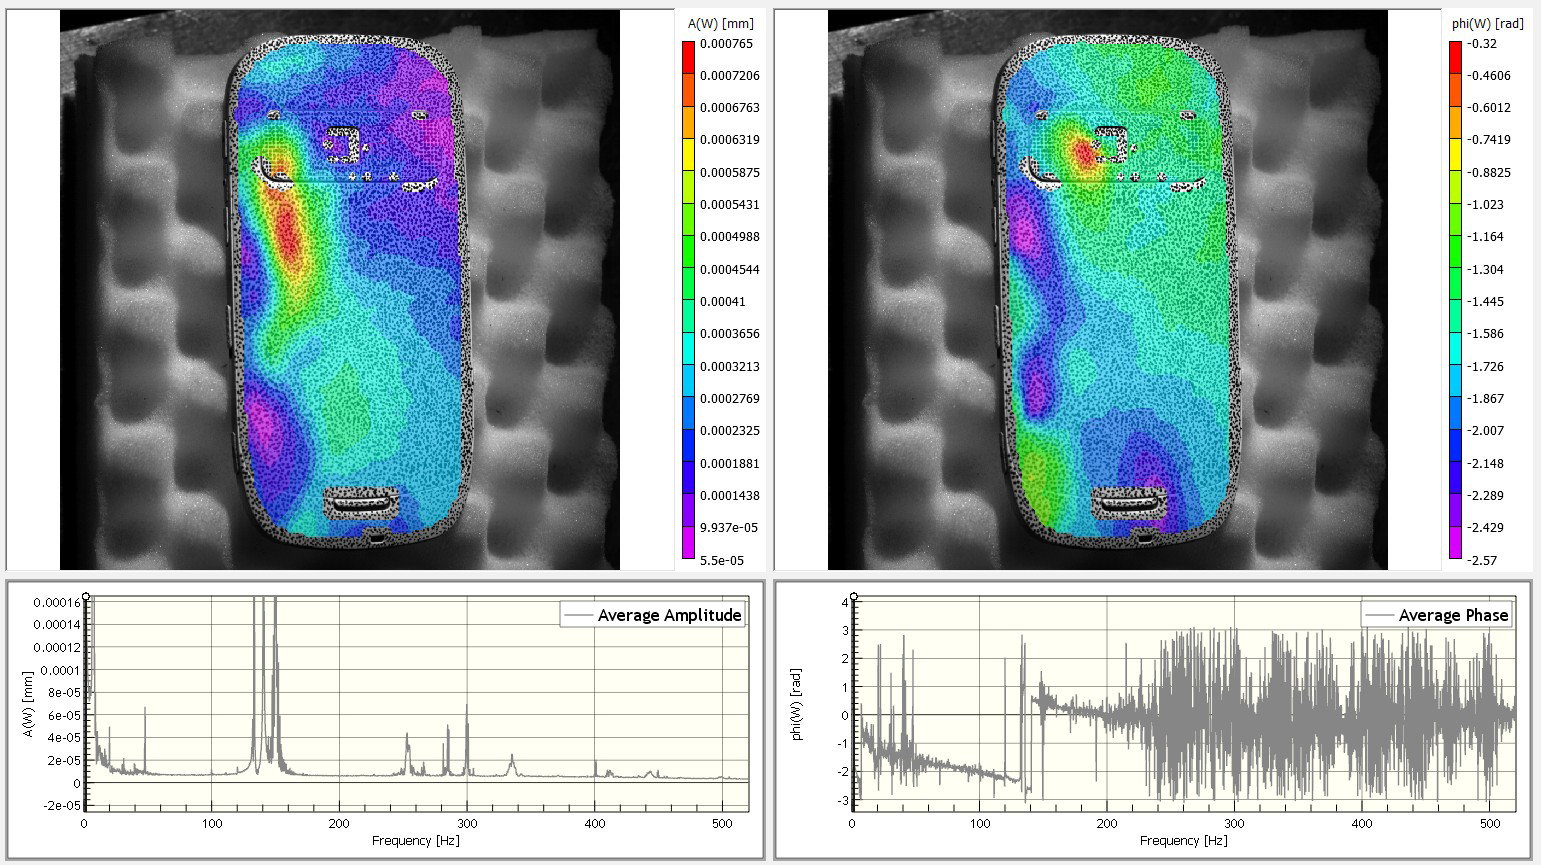
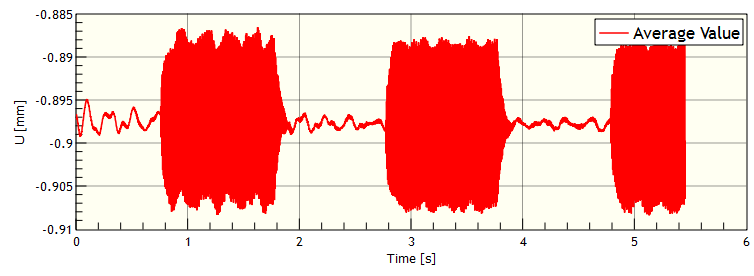
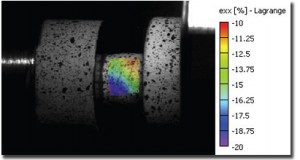
The battery packs are tested by small pressure differences of some mbar, which can be applied in seconds or below in small chambers. The sensor is monitoring the surface of the battery pack while the pressure is changed, measuring the differential deformation of the surface. Due to the expansion of the air bubbles and air pockets, the air inclusions can be located such as shown in the following images.
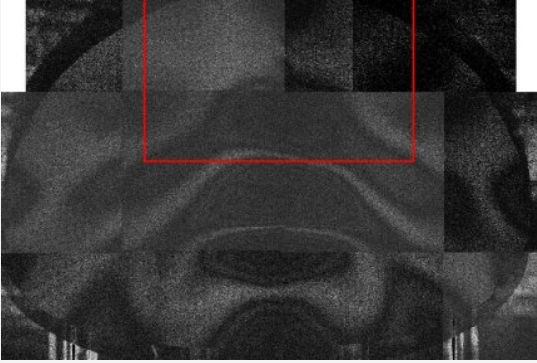
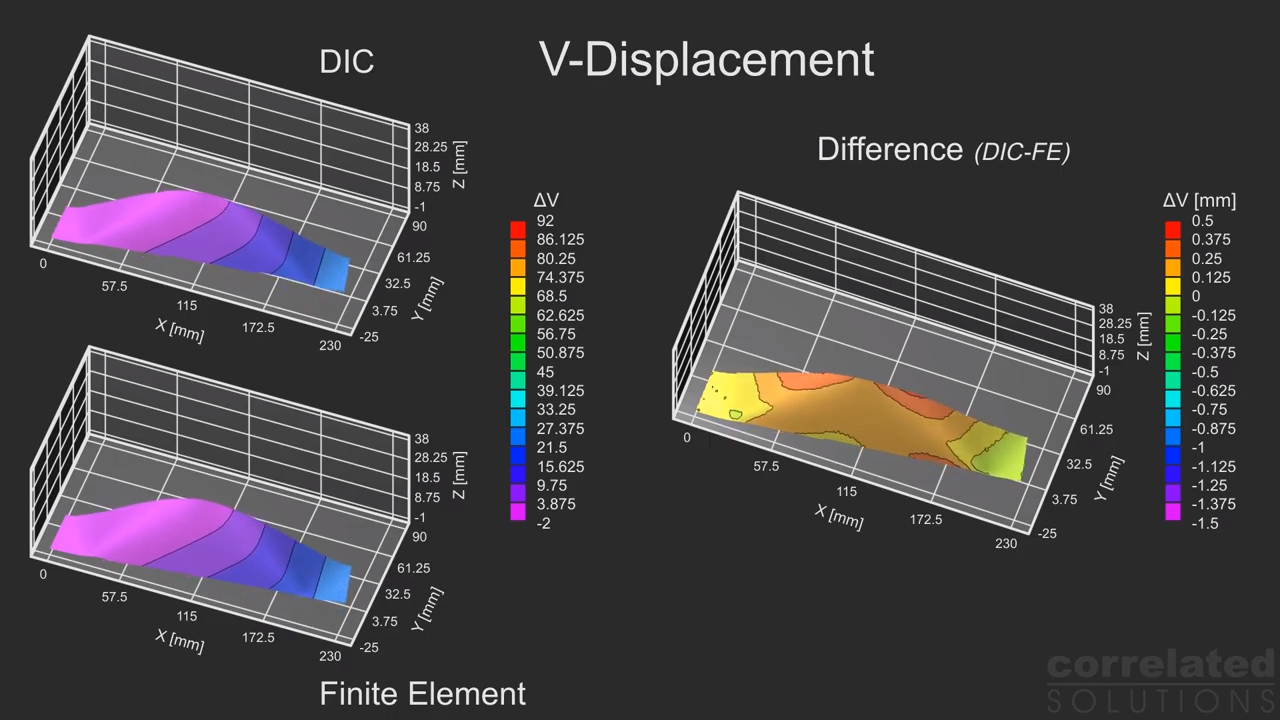
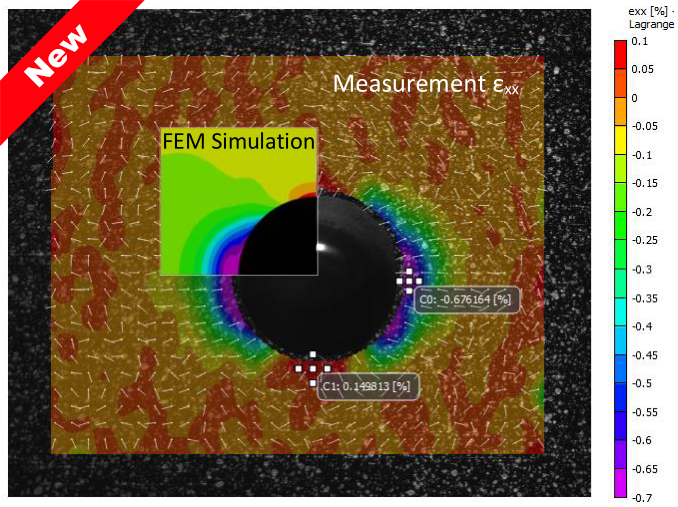
The first image shows the live view of the battery pack from the sensor. The second shows the recontructed phase, which is corresponding to the local deformation gradient.
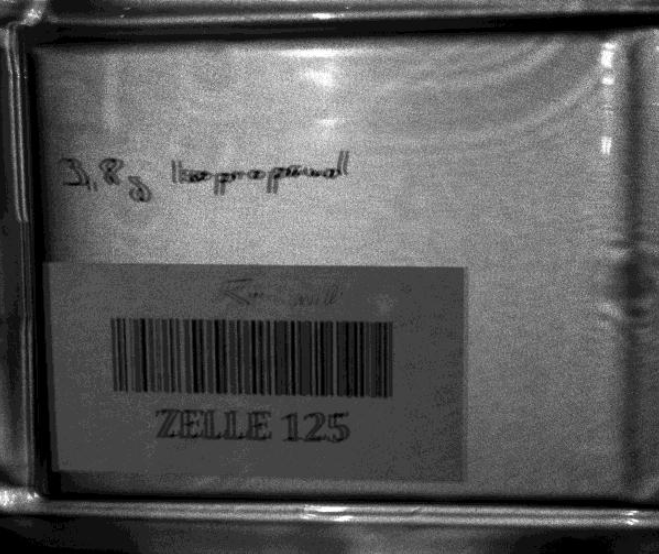
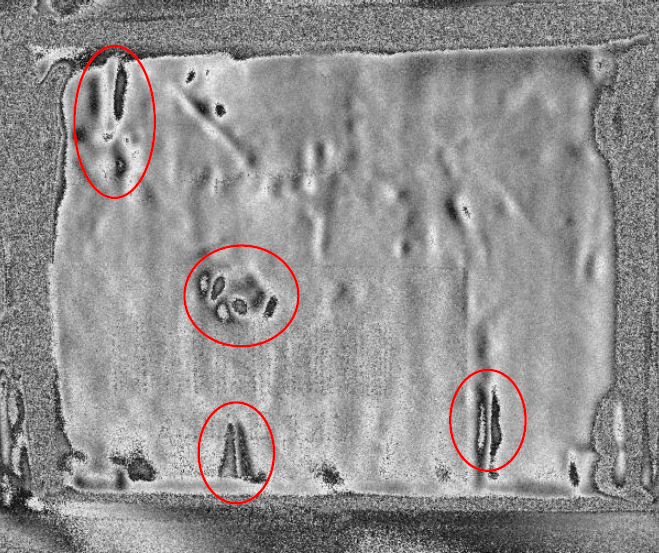
Generally the required pressure difference depends on the defect depth, defect size an the mechanical stiffness of the tested structure, but in general the load is small due to the high sensitivity of the sensor detecting differential deformations of the surface.
 Airbus has built a reputation for innovative aircraft, recognized around the world for their safety and efficiency. All of these attributes are driven by a top-notch testing program, whose innovative practice are evidenced by their use of the
 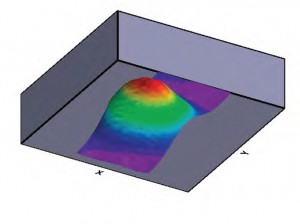 Dr. Richard Burguete, experimental mechanics specialist at Airbus UK since 1997, explains the benefits of this approach as follows: “The VIC-3D system allows us to be sure we have captured all of the relevant data, some of which might have otherwise been unobtainable.”
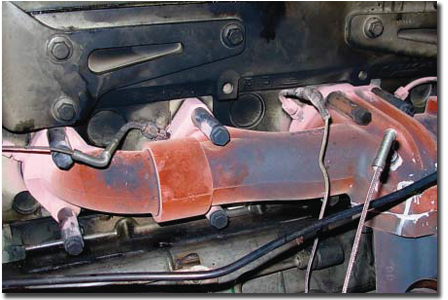 The engineers at Cummins design and test their engines to withstand real-world conditions, ranging from military deployments to heavy-duty industrial sites. Cummins engineers want to know exactly how their parts are deforming under the combination of thermal and mechanical loads. This means they’ve got to perform their tests with the engines running – and hot.