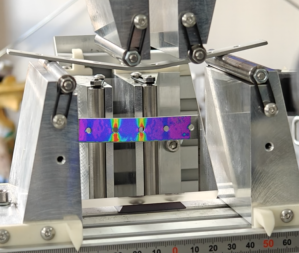
The video shows an experimental setup of a strain measurement with digital image correlation. A segment of a 3 mm wide cable insulation is loaded by a tensile machine until failure.
The video shows an experimental setup of a strain measurement with digital image correlation. A segment of a 3 mm wide cable insulation is loaded by a tensile machine until failure.
The video shows the application of a stereo image correlation (phase synchronized) for a three-dimensional displacement measurement or movement analysis (Vic-3D).
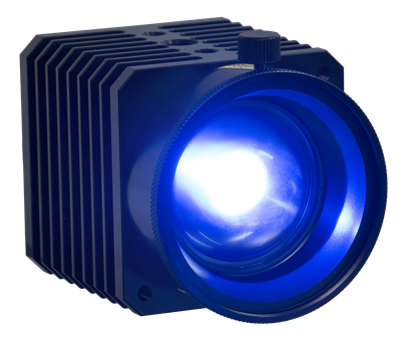
The used stereo camera system is based on two 5 Mpixel cameras with a frame rate of 6Hz (at full resolution) in combination with the isi-sys synchronization and trigger device for stroboscopic observation of periodic events.
X
Four measurement areas (hydraulic cylinder — below, wheel hub — left, swingarm — middle and linear unit — right above) with speckle patterns were monitored for the evaluation. The vector arrows represent the current displacement state.
Application examples of a special stereomicroscope in combination with Vic-3D digital image correlation on electronic components.
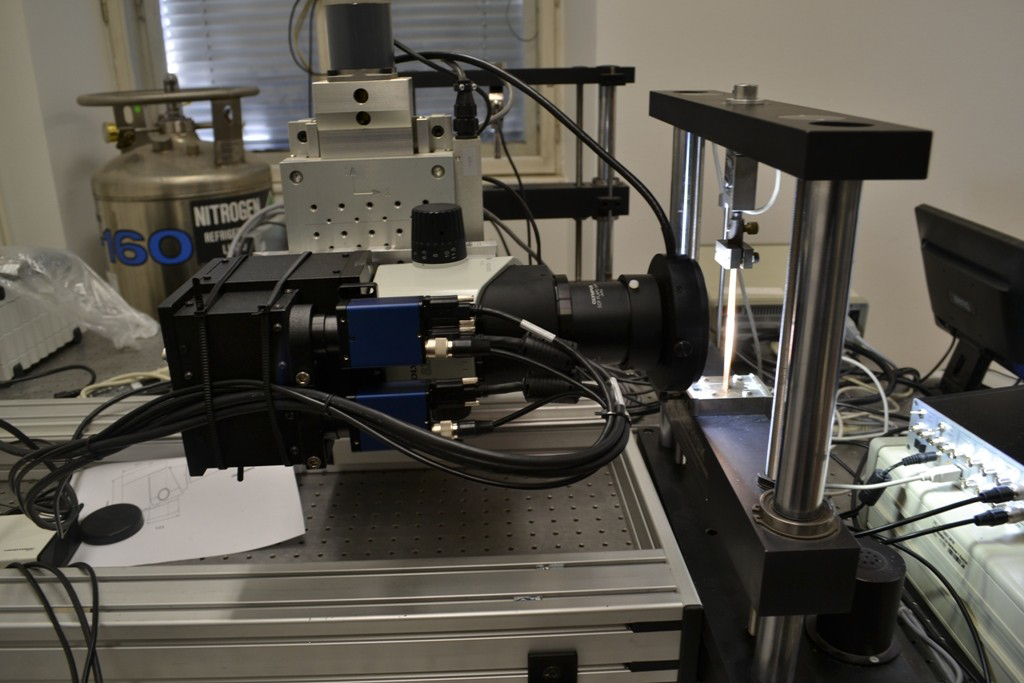
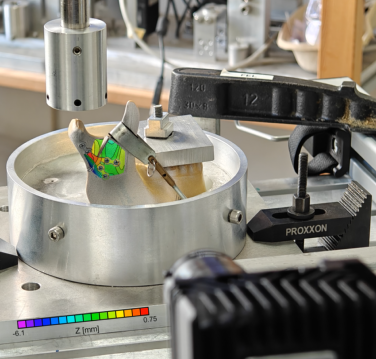
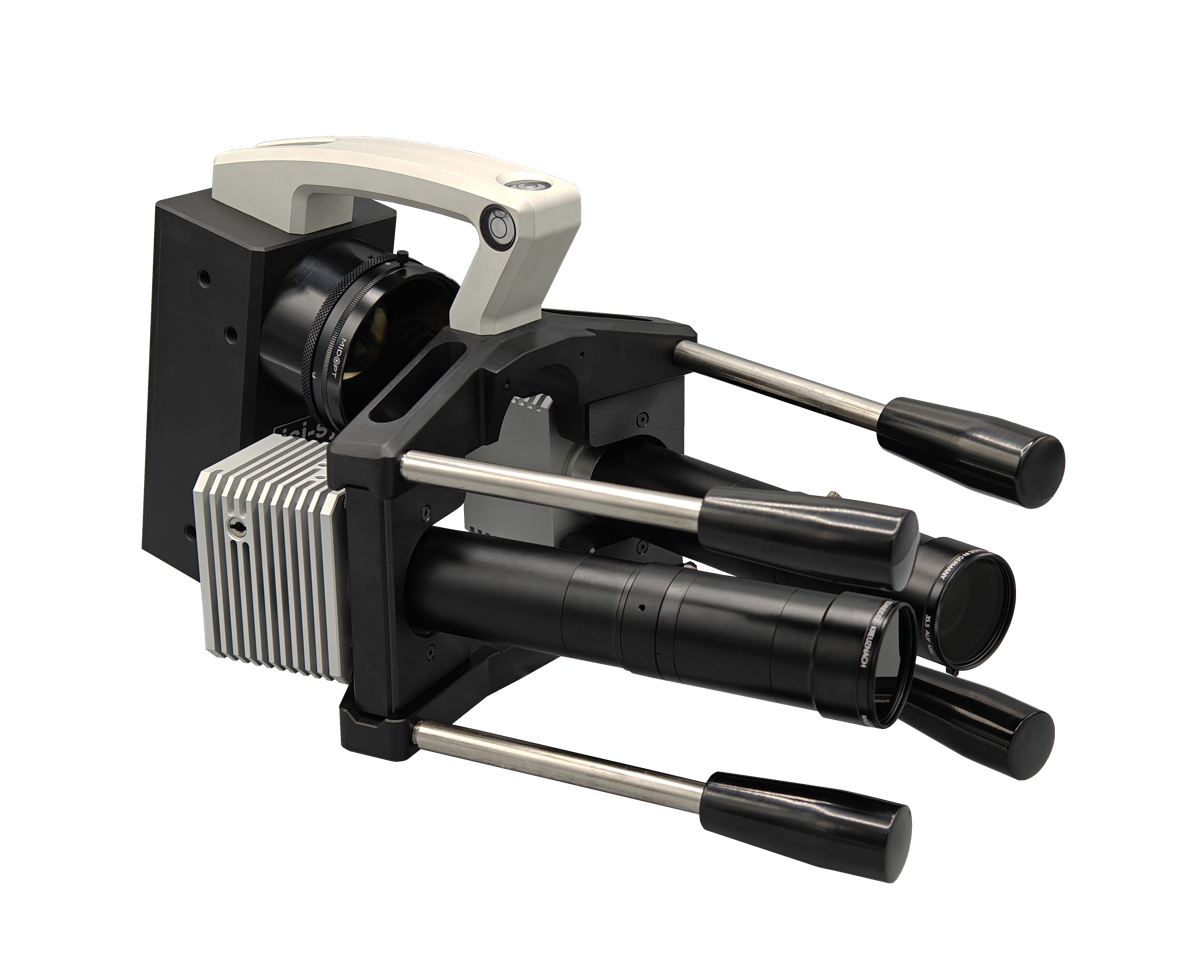
Image 1: Measurement setup
Measurement set up: Stereo microscope mounted on x‑y-z-microtable (backside) and tensile machine (right).
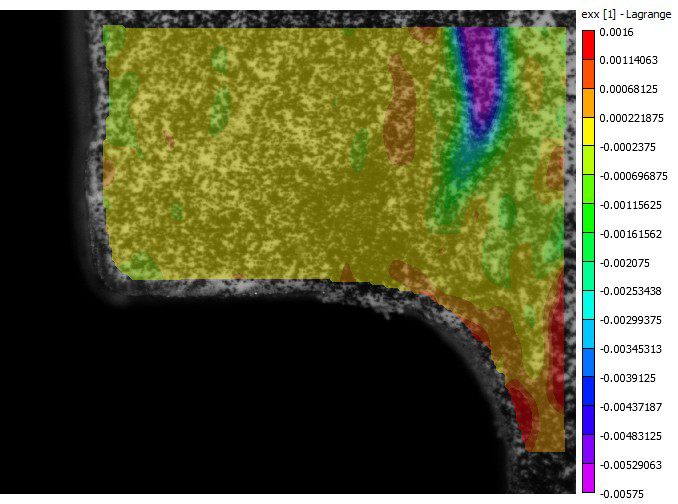
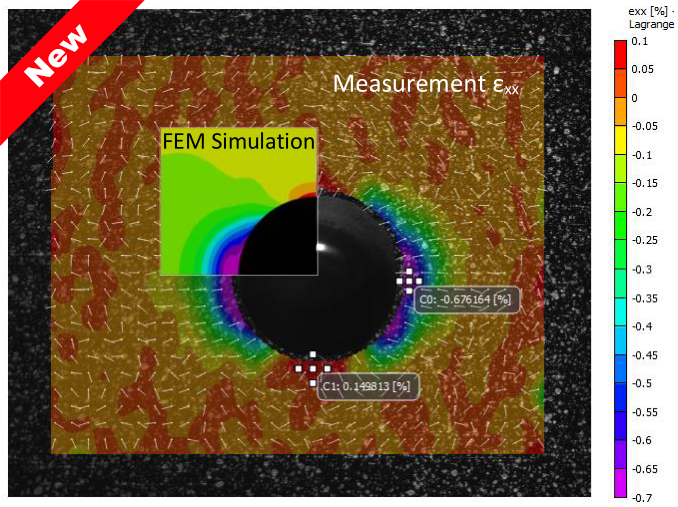
Image 2: Strain in x‑direction
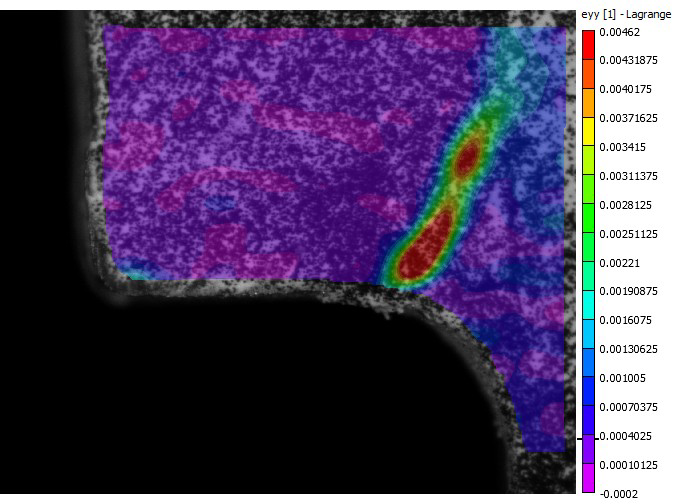
Image 3: Strain in y‑direction
Strain distribution of a half cut capacitor-chip (left part) and its soldering area (round section). The board is under
bending load. The board is vertical on the right sight of the image. The local red area is showing a crack in the
soldering part. Image area approx. <2mm.
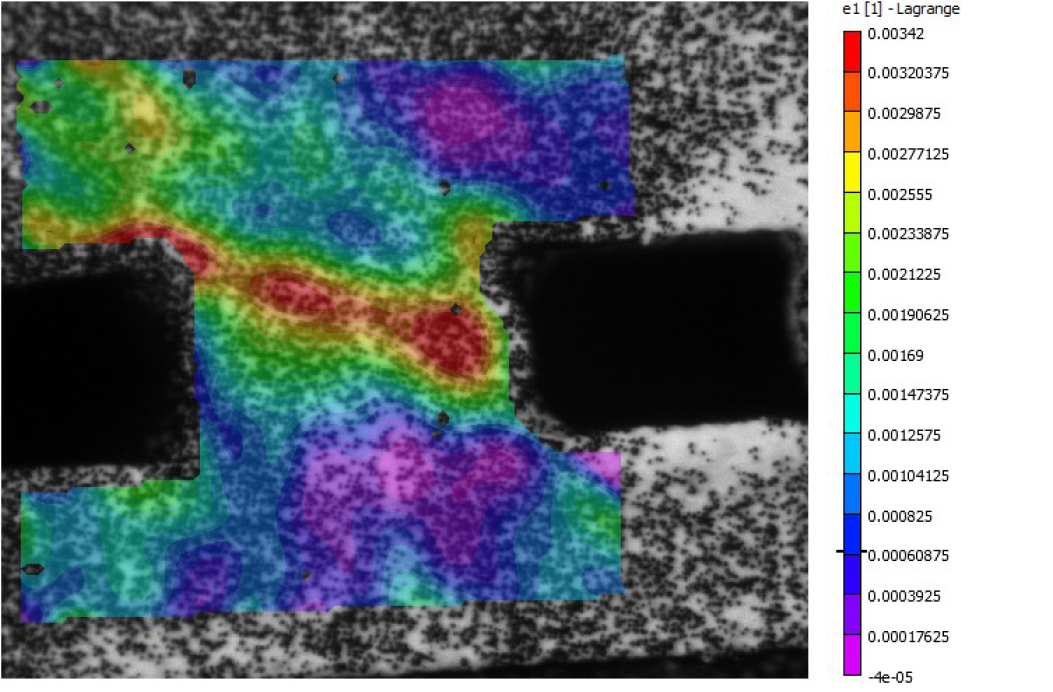
Image 4: The main strain of measuring a solder ball d=300µm under horizontal shear stress is shown.
x
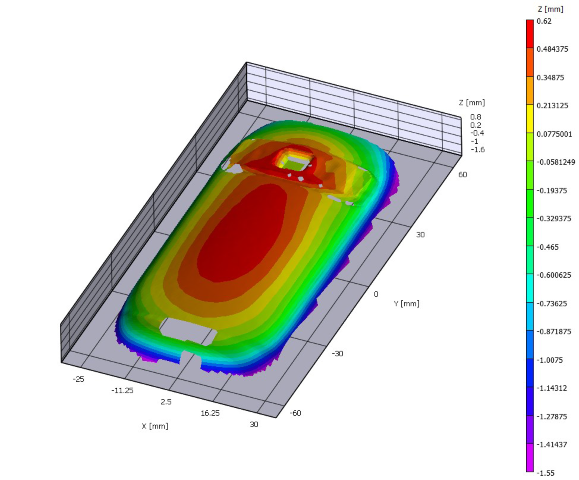
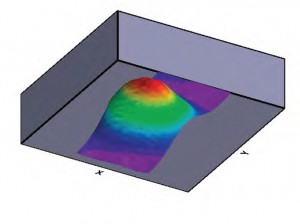
Reference coordinates and contour of the mobile phone.
x
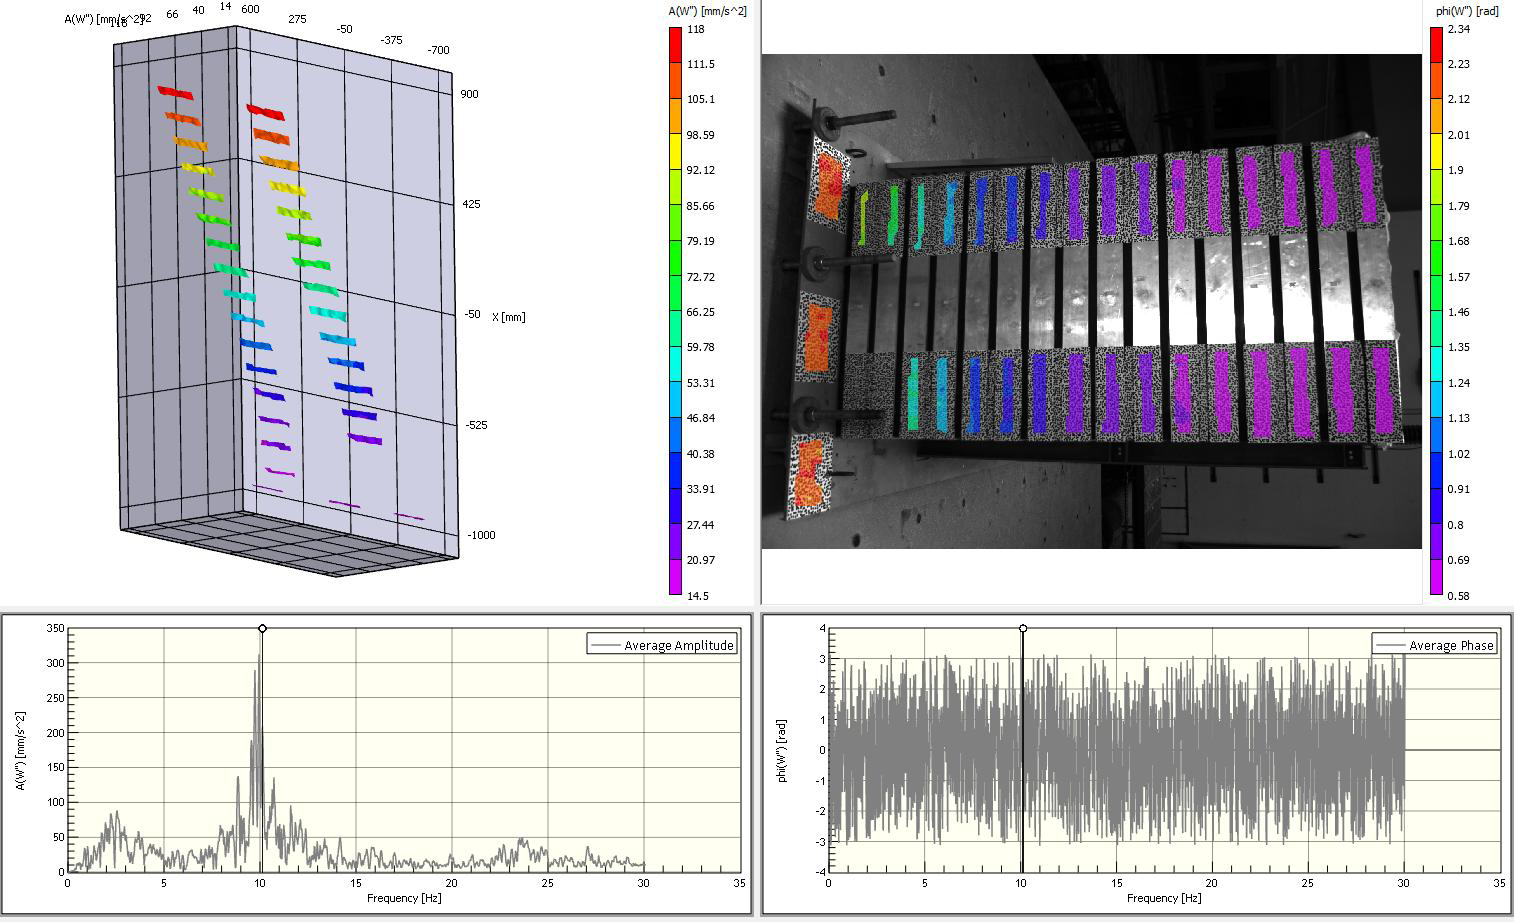
This article describes the measurement and analysis of the operation deflection shapes and rigid body vibration motions of a mobile phone excited by its vibration alert. The mearurement is done, using a non contact, 3D, full-field, high speed stereo image correlation system in combination with the new Vic-3D FFT module analyzes the recorded deformation data in the frequency domain by phase-separation method.
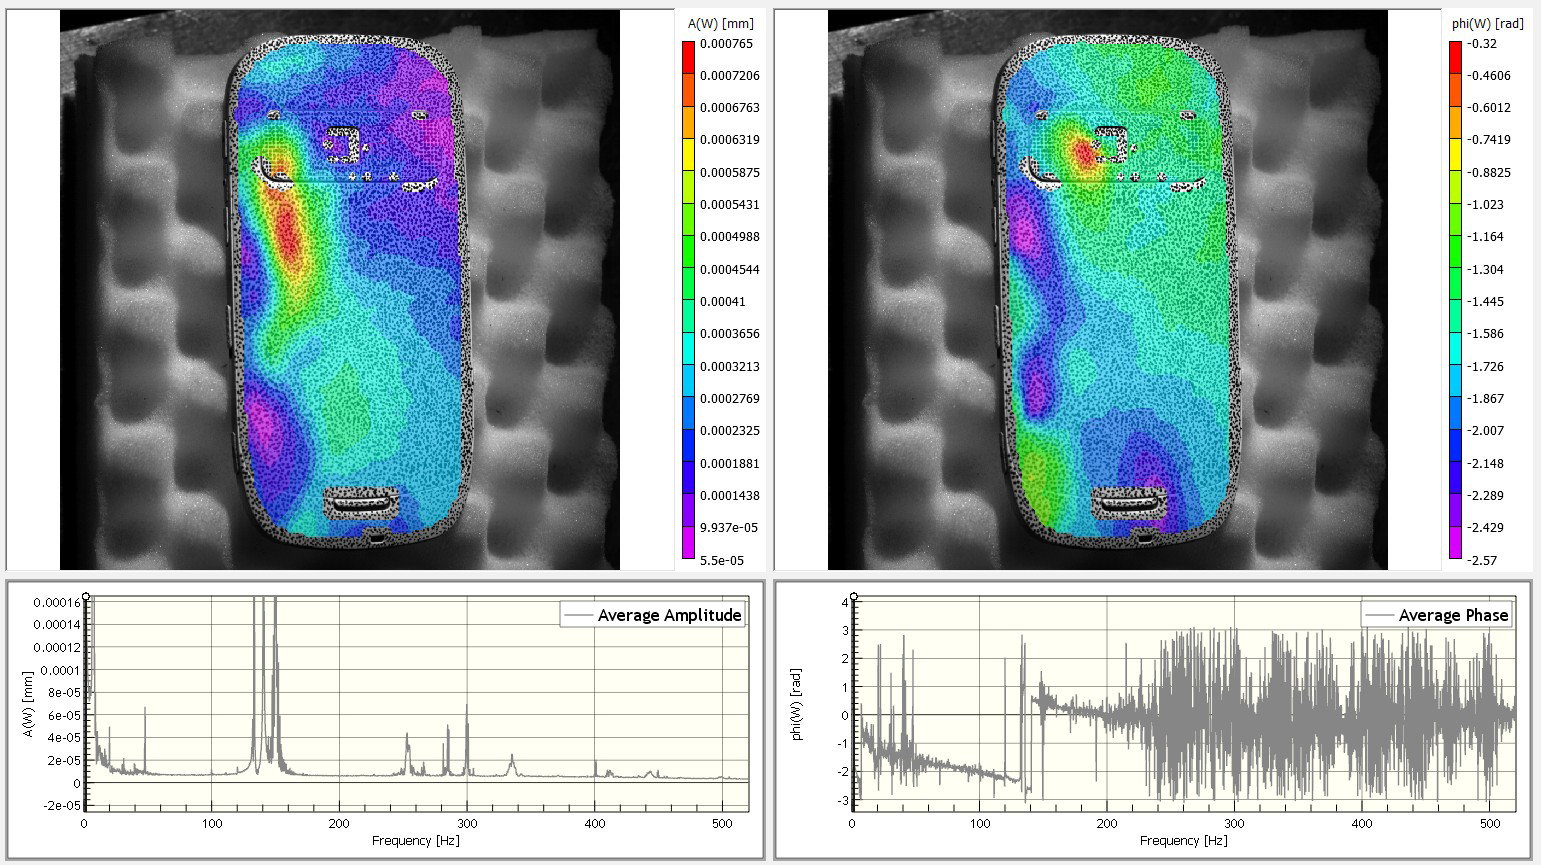
The measured deformations and displacements during the vibration alert are evaluated against the reference state for each stereo image pair. In this case the recording time covers about 5,5 seconds with 1000 FPS corresponding to about 5500 single measurements.
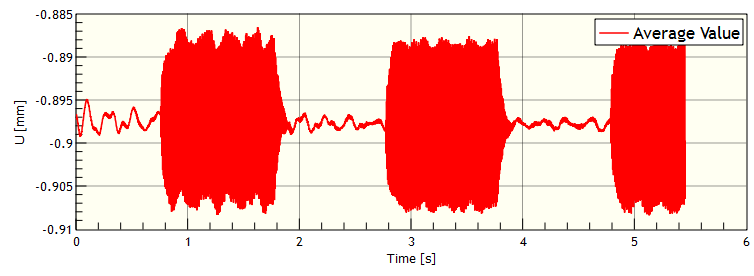
The following figure show the average vibration amplitude U.
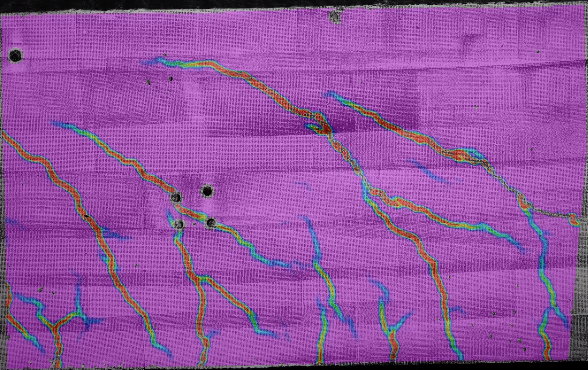
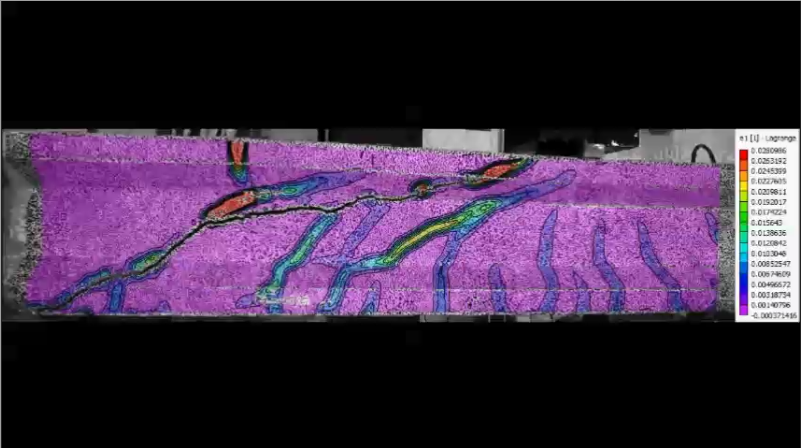
The film shows a DIC Measurement using Vic-3D on a concrete beam during a three point bending test. The first crack opening <1µm is located at the lower right side of the beam.
Final conditions: Over the entire length of the concrete beam several cracks have formed.
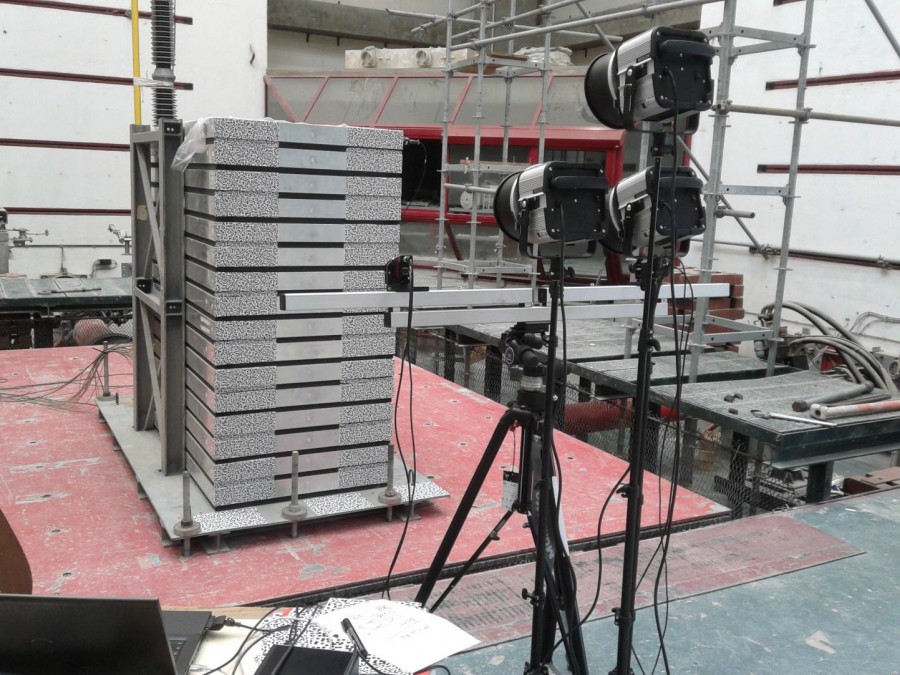
The correlation of an earthquakesimulation
was measured with the Vic-system and high speed cameras.
Several concrete slap was stockpiled on
a shakertable for the experimental setup.
Biomechanic researchers were studying the contractions of a rat Tibialis Anterior muscle. It was desirable to quickly and accurately quantify the overall movements, as well as localized variations.
Because the experiments involved live tissues, conventional gauges were difficult to apply and tended to interfere with the motion under study. It was important to capture data quickly, and for as many points as possible. Marker tracking had been used, but provided only gross averages. It was also time-consuming and tedious for the researchers to process this type of information.
The Vic-3D system was used to rapidly capture contraction data over the entire muscle surface. Due to the system’s speed and simplicity, it was possible to make numerous measurements at precisely timed intervals. There was no interaction with the specimen, and no need to guess which areas would be of greatest interest.
The resulting measurements provided high spatial resolution and made it possible to identify numerous areas where “bunching” of the muscle tissue caused significant variations in muscle contraction. These areas had not been previously identified with conventional methods. Finally, all calculations were done automatically. This saved considerable time and avoided the possibility of human error in the data processing.
 Airbus has built a reputation for innovative aircraft, recognized around the world for their safety and efficiency. All of these attributes are driven by a top-notch testing program, whose innovative practice are evidenced by their use of the Vic-3D measurement system.
One of the goals of the Airbus testing program is to characterize the structural damage caused by collisions between the aircraft and small projectiles such as birds and other ground based debris, and to ensure that the structural integrity of the aircraft is maintained.
This type of event can be reproduced by firing a variety of different types of projectile at a piece of aircraft structure at a high velocity. The results obtained can be used to compare with computer models of the structure under impact loads, leading to more highly optimized and safer designs.
 Dr. Richard Burguete, experimental mechanics specialist at Airbus UK since 1997, explains the benefits of this approach as follows: “The VIC-3D system allows us to be sure we have captured all of the relevant data, some of which might have otherwise been unobtainable.”
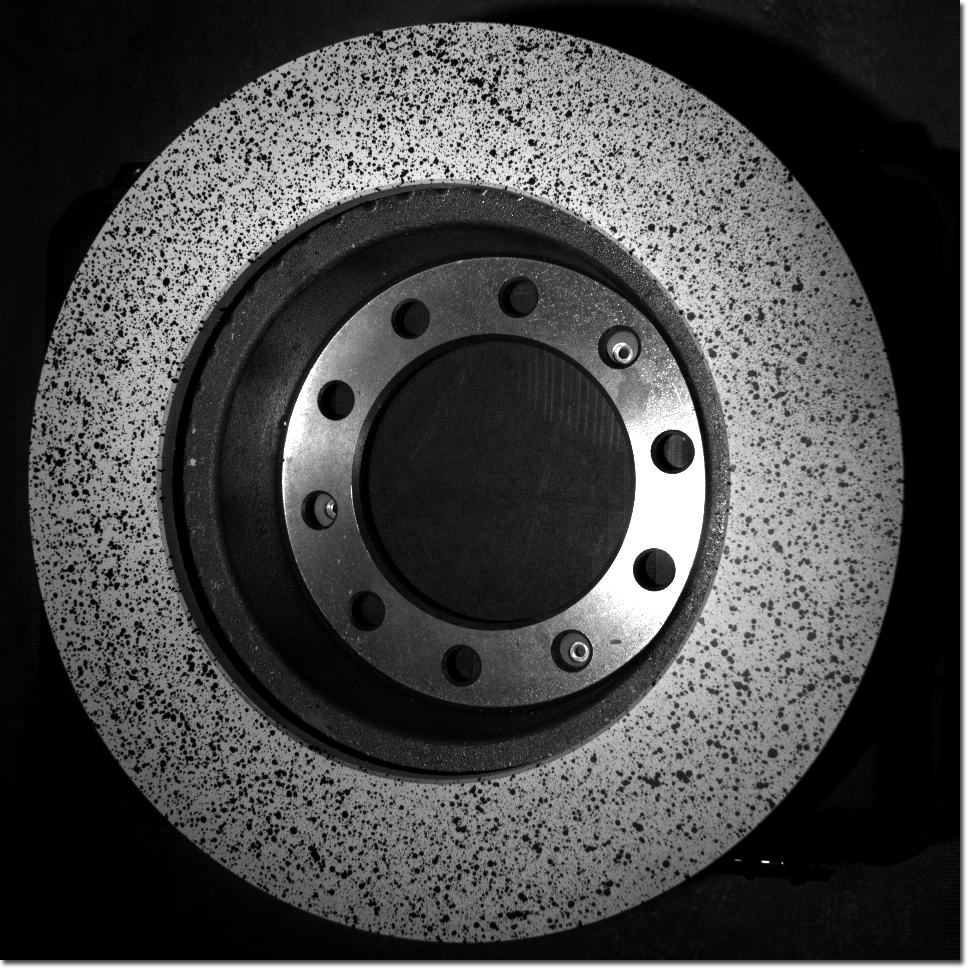
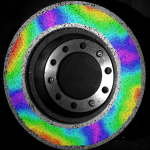
In this example, a 14” diameter brake disc from a heavyduty truck was excited using a small hammer to measure the vibration shapes of the rotor. The three-dimensional operational deflection shapes were easily identified and measured using the Vic-3D™ HS Vibration Analysis System. Amplitudes as small as 40 nanometers were measured at a frequency of approximately 2,000 Hz.
Assembled components typically have complex interactions with one another. Contact points can vary during operational cycles due to part movement. This means that the locations of peak strains can be hard to predict, and they are often not stationary. The movement of parts can also make it impractical to maintain electrical connections with gauges. Even when they are stationary and easy to locate, the highest strains can be concentrated in very small areas or have high gradients. Peak values may be lost to the averaging effect produced by gauges.
Vic-3D provided a means for making strain measurements across the entire profile of the gear tooth. Because it provides full-field measurements, it was not necessary to choose a particular point at which measurements would be made. This allowed the peak strains to be clearly visualized and accurately measured at various stages of the operational cycle. Vic-3D also measured displacement in three dimensions. This feature allowed our customer to recognize and quantify twisting of the gear tooth under load.