The potential of ultrasonic wave superposition to improve the properties of laser beam welding was investigated using stationary and moving Piezoshaker-System at the Department of Cutting and Joining Manufacturing Processes (tff) at the University of Kassel. An example of this is the test on the high-strength steel alloy 22MnB5, which is presented here. Adaptation to other welding processes and materials is possible.
The influences of the various excitation parameters of the Piezoshaker on the ultrasonic wave superposition were investigated, e.g. the distribution of the AlSi-coating particles within the joining zone as well as the weld seam properties [1].
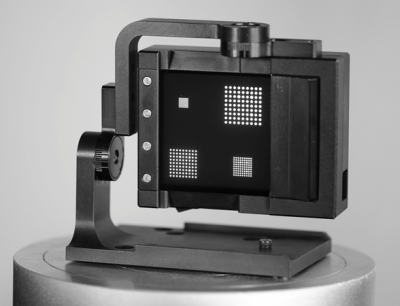
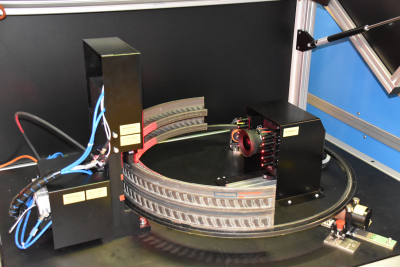
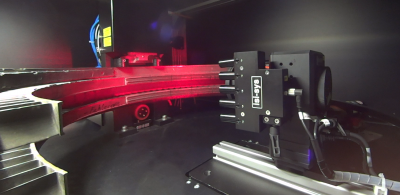
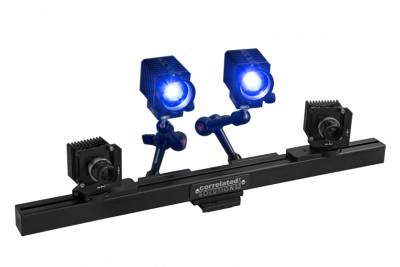
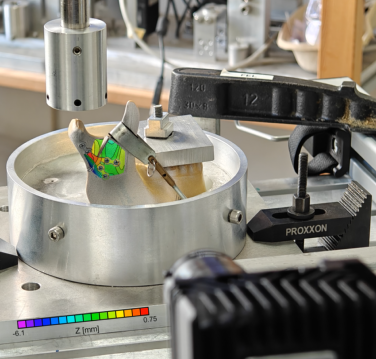
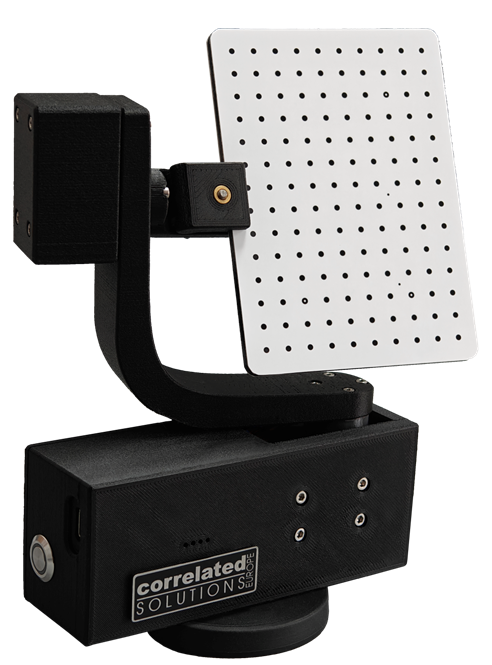
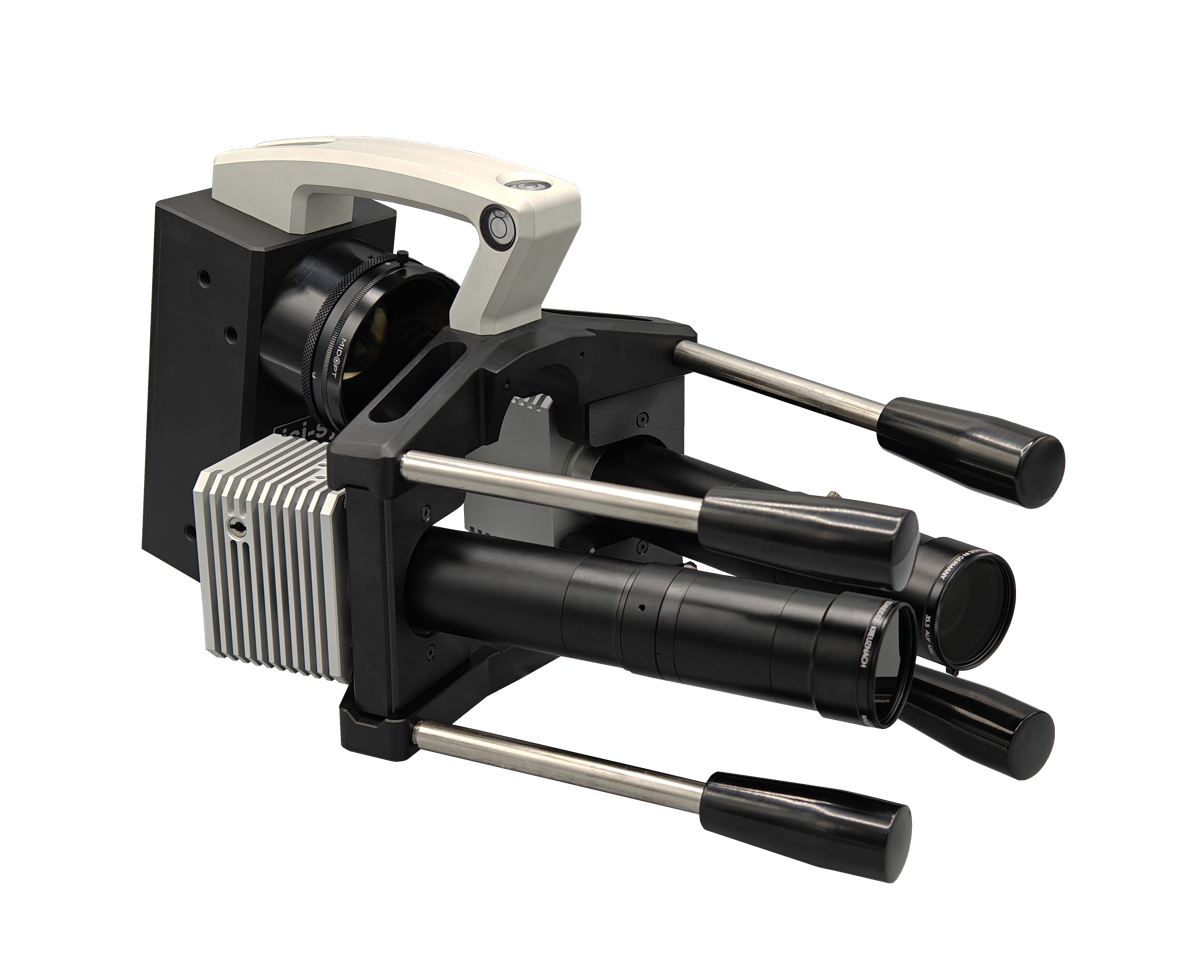
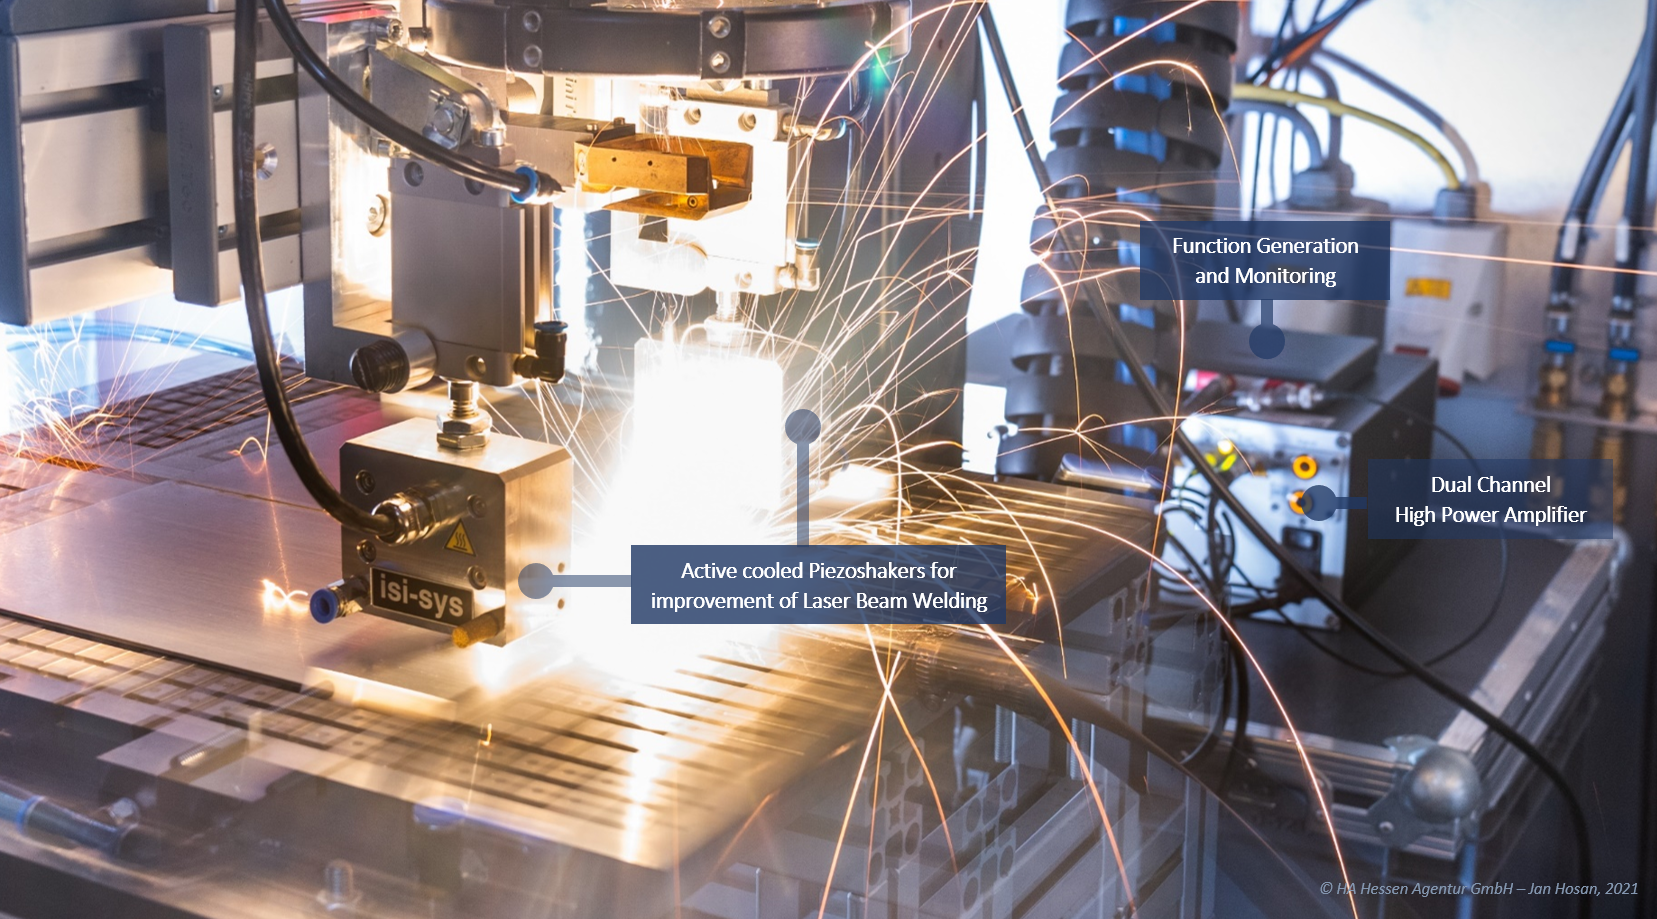
The isi-sys Piezoshaker-System was used for the moving wave superposition, as shown in Fig. 1 The system contains a 2‑channel Piezoamplifier of the HPDA‑0–180-2C series and two Piezoshakers of the PS-W-02 series. The Piezoshakers are firmly connected to the laser optics via a mount and are moved relative to the component surface at a defined distance from the laser beam. These are pressed onto the component surface with a defined force using pneumatic cylinders. Unevenness and differences in the thickness of the joining partners can be compensated.
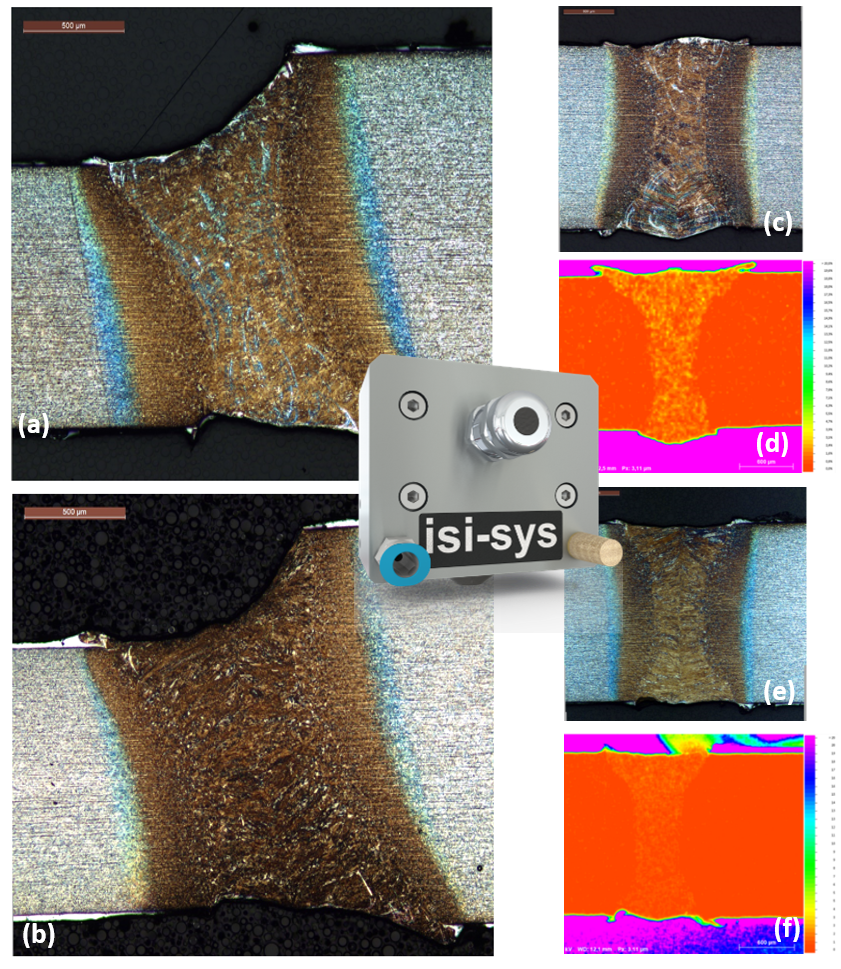
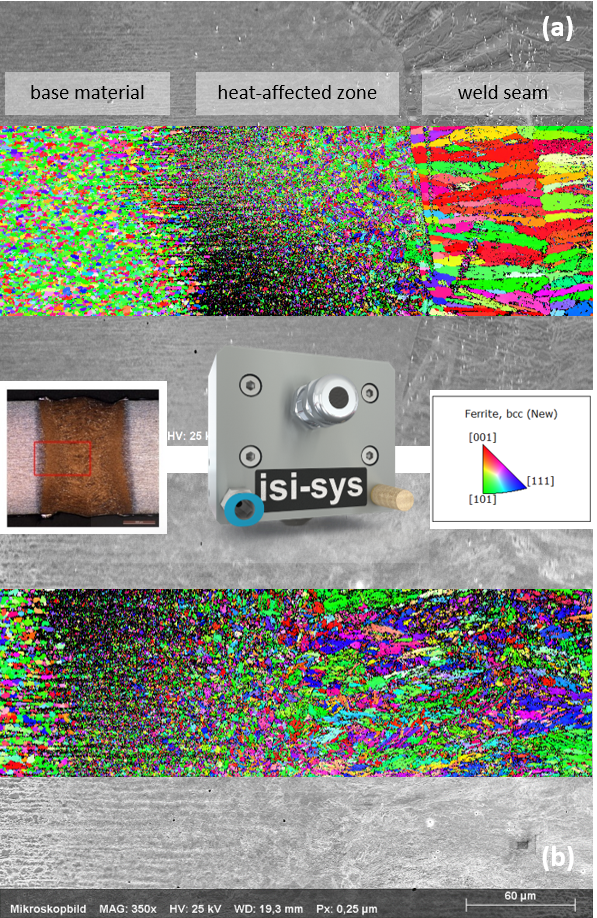
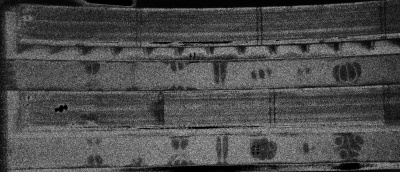
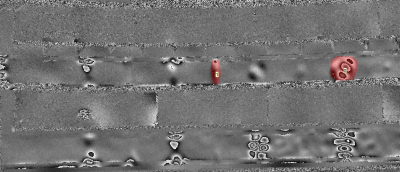
Fig. 1 (left): The distribution of the AlSi-coating in comparison without (a) and © and with (b) and (e) influence of an ultrasonic wave superposition by isi-sys Piezoshaker during laser beam welding with false-color images of EDS-analysis (d) and (f) [1]
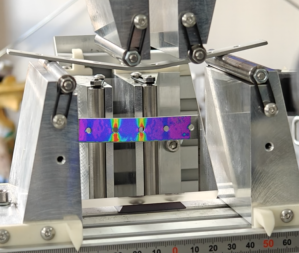
Fig. 2 (right): Superimposed SEM-images and sectioned inverse pole figure mappings (IPFM) of a weld seam without (a) and with ultrasonic superposition (b) measured with electron backscatter diffraction shown as inverse pole figure in Z‑direction [1]
[1] Published in: C. Wolf, S. Völkers, I. Kryukov, M. Graß, N. Sommer, S. Böhm, M. Wunder, N. Köhler und P. Mäckel, „Enhancement of Weldability at Laser Beam Welding of 22MnB5 by an Entrained Ultrasonic Wave Superposition,“ In: Materials 2022, Bd. 15, 4800.
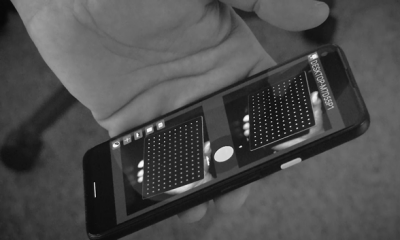
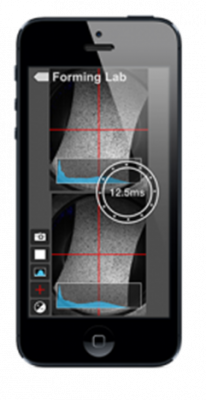
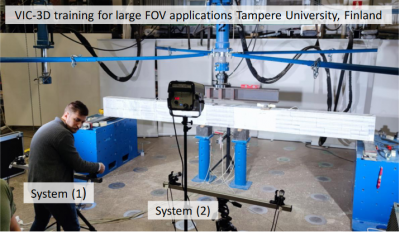 Parallel use of stereo systems
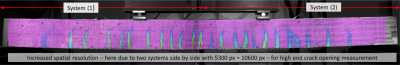
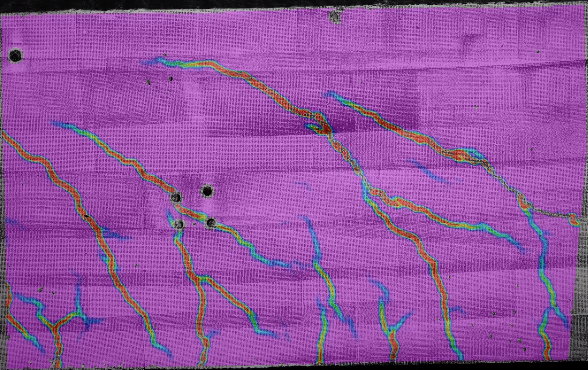
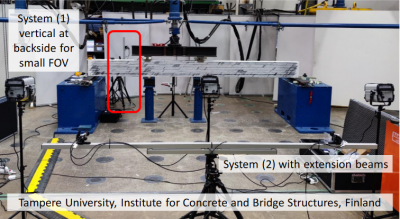 Here, opposed systems operate at different field of view ranges. Click for the high-resolution measurement of principal strain ε1 and ε2 taken from the backside.