The Vic-3D™ Vibration Analysis System by Correlated Solutions, Inc. is a new addition to the Vic-3D product line of measurement solutions. Vic-3D Vibration enables full-field 3D viewing, measurement, and analysis of transient events. Full-field operational deflection shapes in the frequency domain can easily be seen and compared with levels of accuracy in the nanometer range.
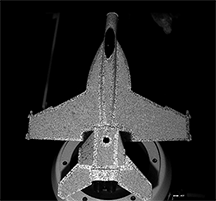
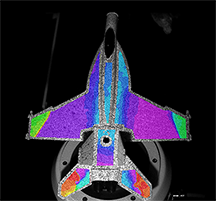
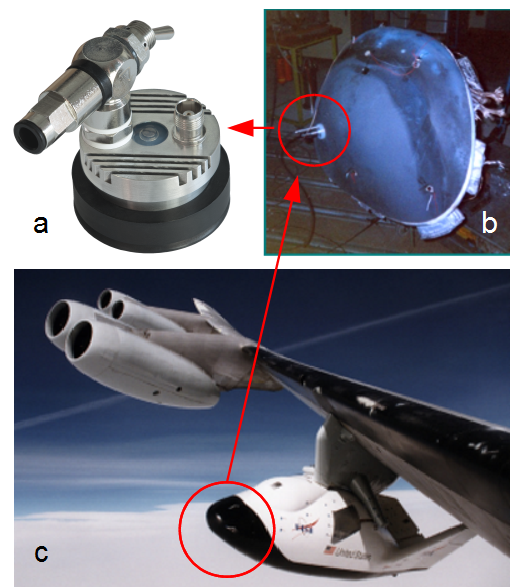
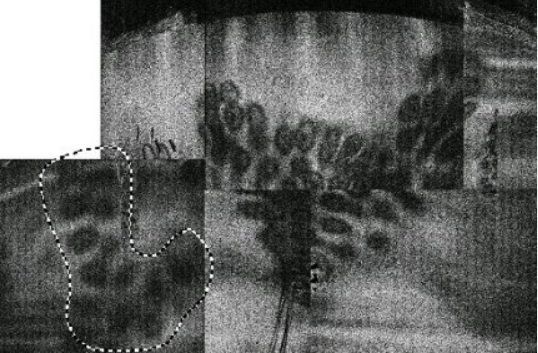
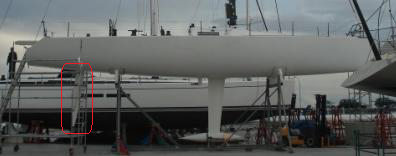
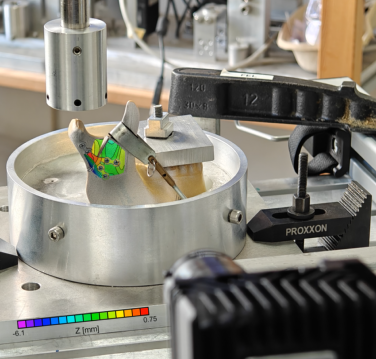
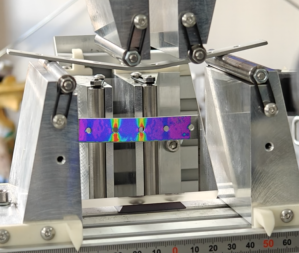
The image above on the left is a mounted model jet plane which has undergone a transient vibration event. To the right, the 3D vibration data obtained from the event is shown as a 2D contour overlay on this image. The data overlay enables the user to see exactly how much deformation is occurring and where it is occurring. This information is available at each frequency where deflection shapes occur.
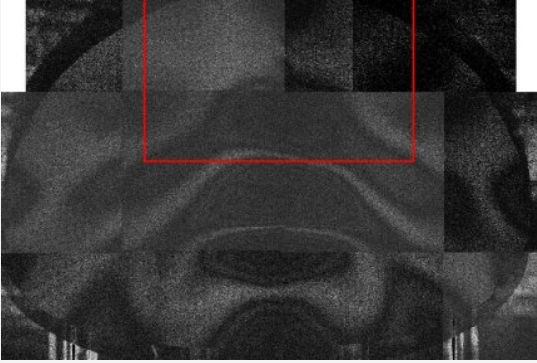
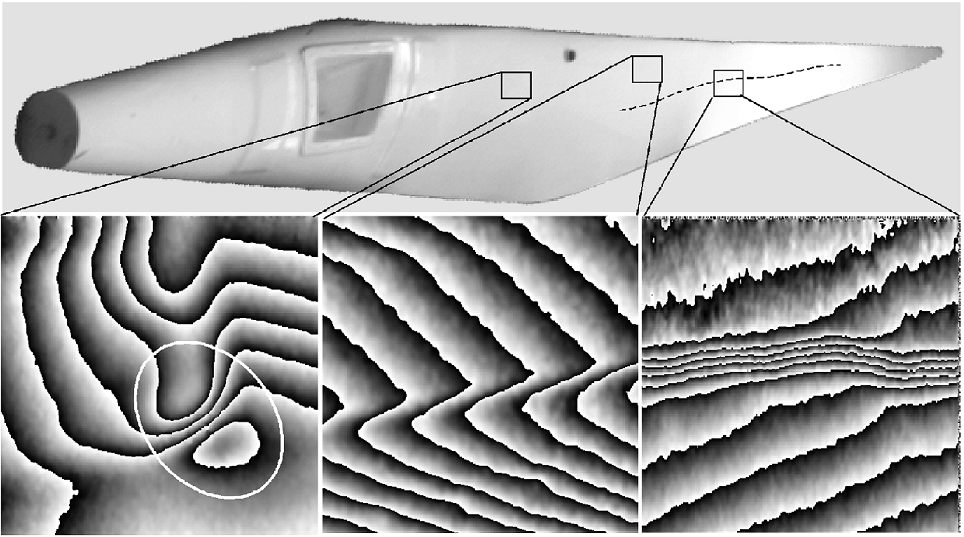
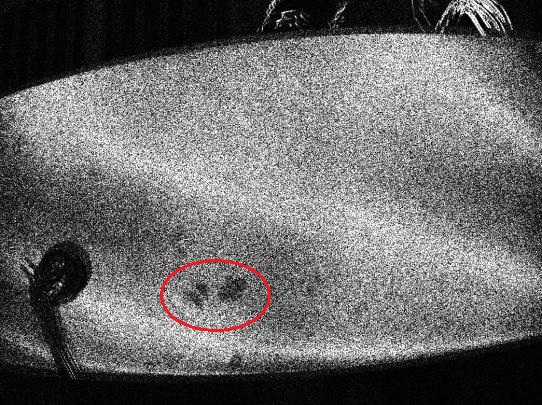
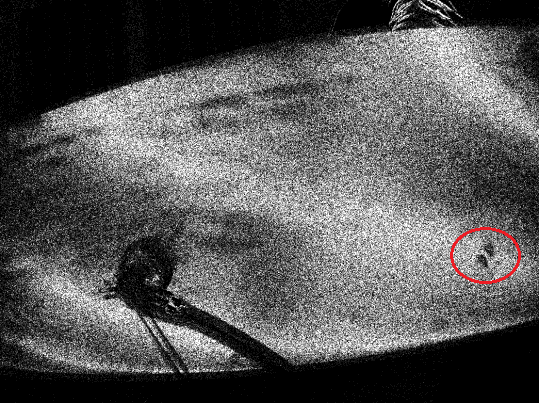
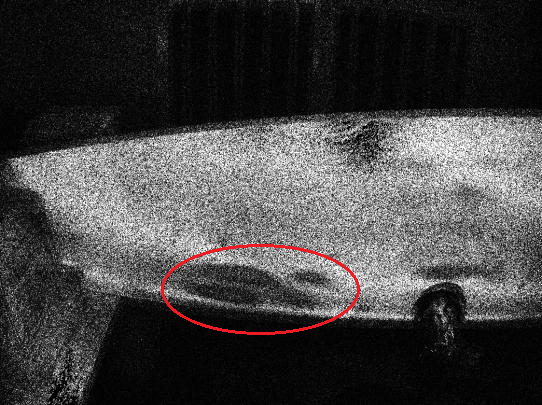
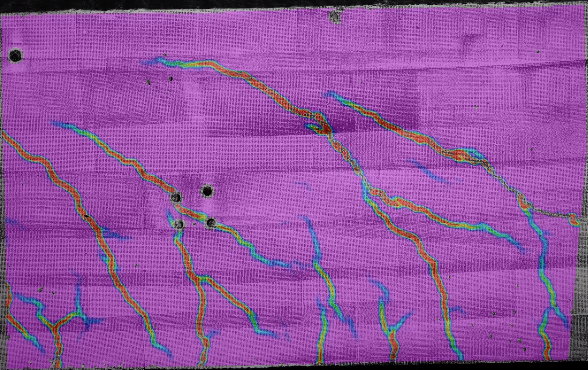
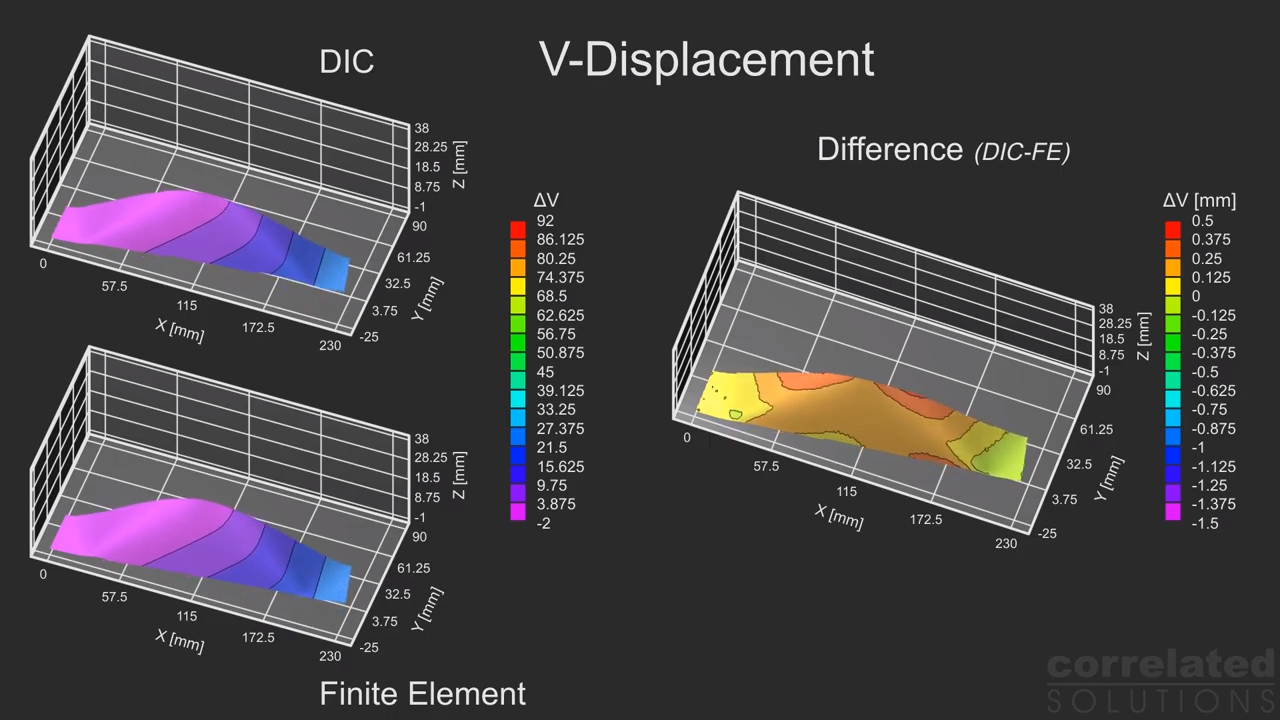
The data below displays one operational deflection shape obtained with the VIC-3D™ Vibration Analysis System. Three-dimensional displacements, strains, velocities, and accelerations can all be computed in the analysis software. The result is not only visual, but also enables the user to export quantitative data (ASCII, MatLab, CSV, etc.) from the sample’s behavior for FEA analysis and validation. A 3D animation of the model jet’s operational deflection shape at 441 Hz is shown below, with only 12 microns of displacement amplitude.
What is transient vibration analysis?
Transient vibration analysis is the process of monitoring, measuring, and analyzing the condition of samples during a transient event. Material properties can also be observed through the analysis of operational deflection shapes and mode shapes created by the event. These full-field 3D shapes can provide useful information which can be used to improve and correct a sample’s balance, displacement, flexure, rigidity, and overall product performance. Measuring operational deflection shapes can help answer the question: “How much is this structure actually moving at a particular frequency?”
Why is it important to you?
Operational deflection shapes created from transient tests show how a sample can have a nonuniform thicknesses, surface irregularities, weak points, cracks and/or other imperfections & flaws. This information can be useful at any point in the process of achieving your overall goal, from writing a project proposal to testing a functional or failing part in the field: The Vic-3D™ Vibration Analysis System
- Has a justifiable price point when writing proposals
- Can be used:
- To create and validate FE models when designing parts & equipment
- During the research and design process
- In the product testing phase
- To provide manufacturing quality assurance
- To certify and assure equipment is operating as expected and required
- To measure and analyze parts post-installation
- To ensure product quality and performance over time and in the field
- When reassessing product functionality over time
Examples of transient events which can be measured are the following:
| ▪ Door Slams |
▪ Modal Hammer Strikes |
| ▪ Engine Start-ups |
▪ Drop Tests |
| ▪ Explosive Testing |
▪ Ballistic Testing |
System Features
- View, compare, animate, graph, extract, and export data for easy FEA comparison
- Measure 3D full-field, high frequency mode shapes with nanometer resolution
- Measure extremely low amplitudes with extremely high accelerations
- Full-field strain, deformation, and shape variables are still available
- Easy procedures, accurate results
- User friendly interface
- Only a fraction of the price of a laser vibrometer system
Advantages over other measurement techniques
While traditional vibration measurement techniques can be useful, they also have many drawbacks. For example, accelerometers can become unglued during testing, can mass-load a sample, and can only provide point to point measurements, often only in a single plane. Pre-testing and testing can also take days or even weeks to perform on large structures. With the Vic-3D™ Vibration Analysis system, there are no adhesives, wires, signal analyzers, power amplifiers, or load cells necessary for detailed vibration results. Obtaining thousands of data points for a tiny, complex structure or a large one is as easy as changing a pair of lenses. Similar to digital image correlation, laser vibrometers can provide a non-contact measurement solution, but similar to accelerometers, they are also only able provide point to point measurements. A 3D measurement can be achieved with multiple scanning vibrometers, but these are usually mounted on large robot arms which can take up valuable laboratory space and cannot be moved easily once installed. Additionally, these systems are unreasonably expensive for many applications. The Vic-3D™ Vibration Analysis system can be taken into the field with any compatible laptop and together with the Vic-3D™ Workstation, the system can become mobile and secure inside your facility. Vic-3D Vibration Analysis is only a fraction of the price of a 3D scanning laser vibrometer system, and since the module can be added onto any existing 3D system, it’s even more affordable.
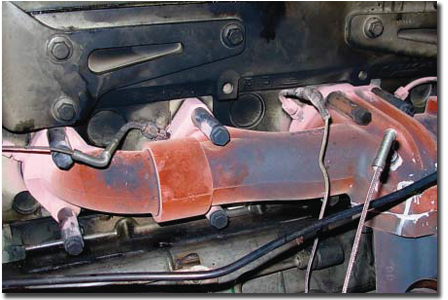 The engineers at Cummins design and test their engines to withstand real-world conditions, ranging from military deployments to heavy-duty industrial sites. Cummins engineers want to know exactly how their parts are deforming under the combination of thermal and mechanical loads. This means they’ve got to perform their tests with the engines running – and hot.
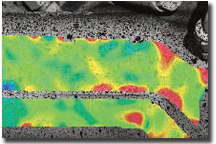


