Studying the behavior of metals during a high-speed dynamic compression event has always been challenging due to the complex test set up and fast data capture rates required. Currently, very little literature is available regarding deformation behavior at strain rates of 10 to 500s-1. Utilizing high-speed cameras, the Vic-3D HS system can be used to quantify the surface displacements and strains in three dimensions over the entire field with great precision. Digital Image Correlation (DIC) has gained widespread popularity over recent years in such high-speed applications due to its high accuracy, flexibility and ease of use.
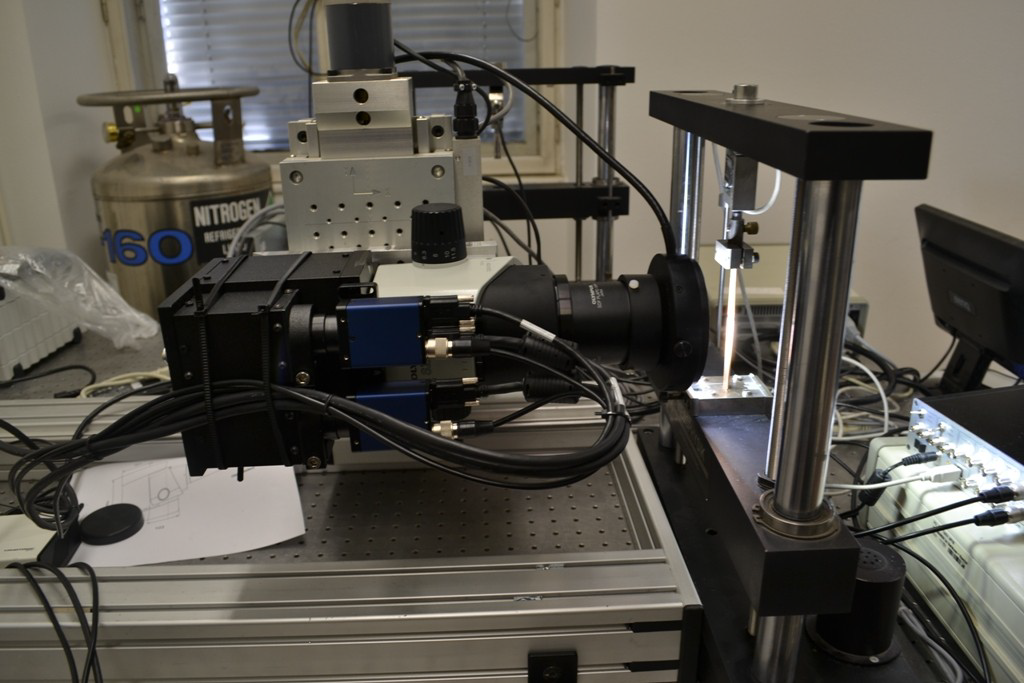
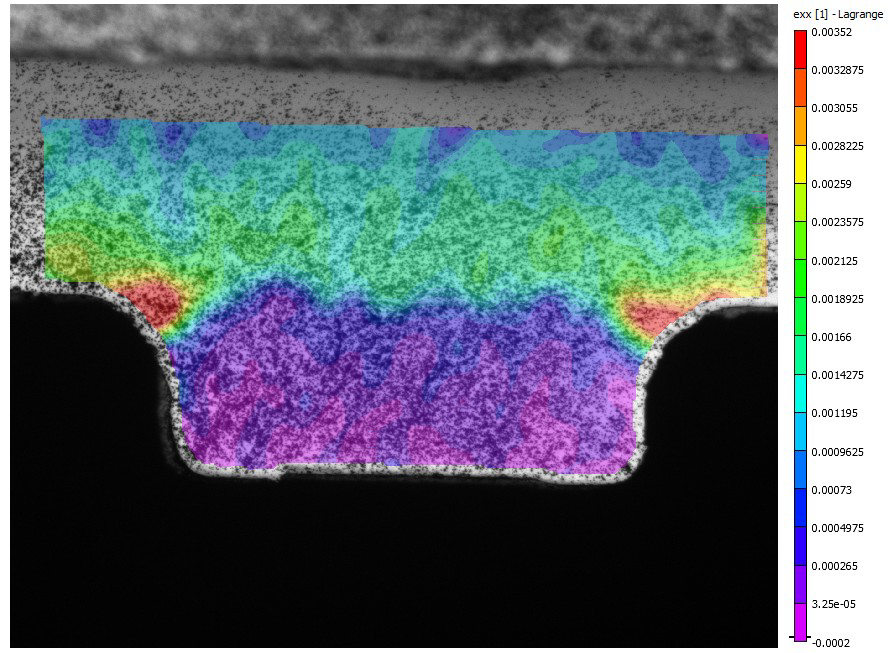
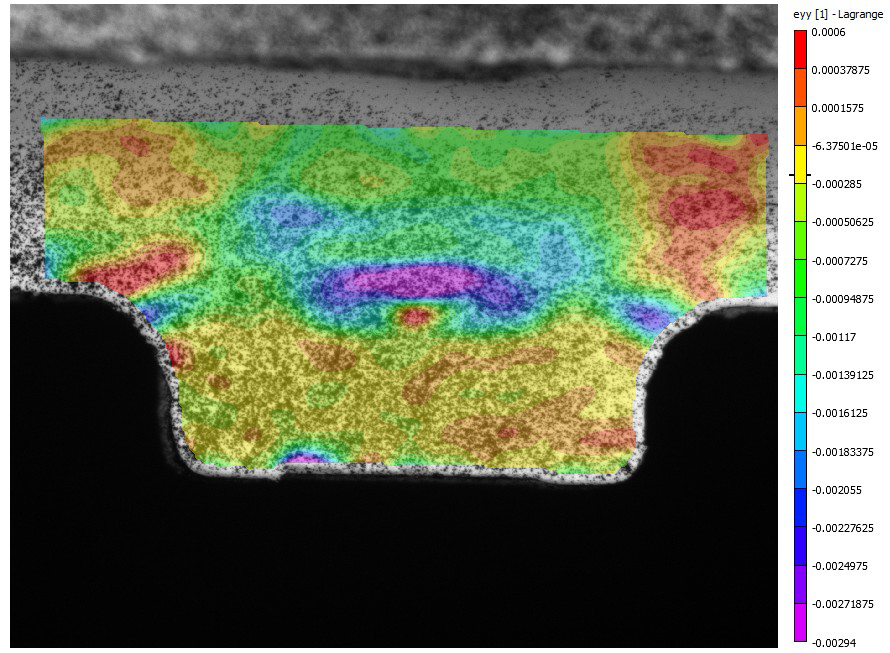
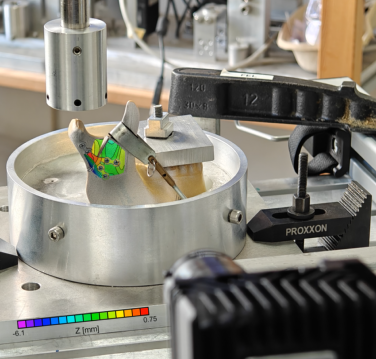
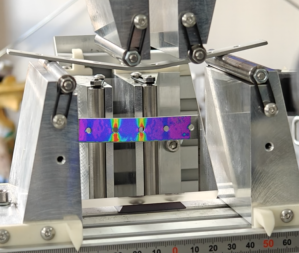
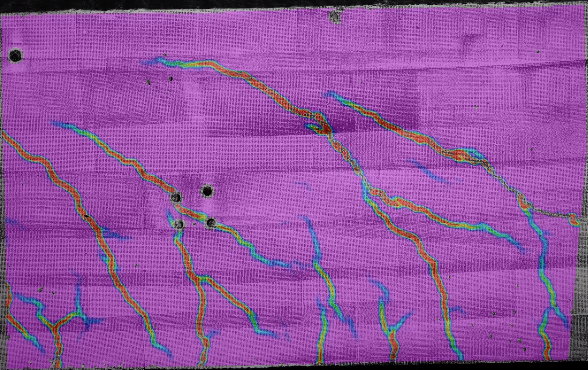
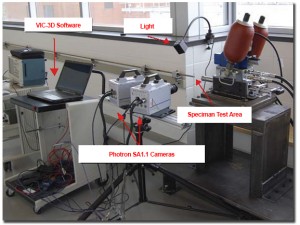
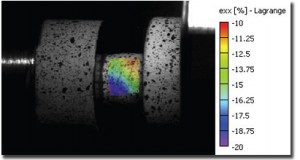 In this example, a 6mm diameter cylindrical specimen was compressed at a strain rate of 50s-1. The Vic-3D HS system was used to capture the surface displacements and strains on the specimen during the event. A random speckle pattern is applied to the specimen that allows the analysis software to easily track the deformation to sub-pixel accuracy. Although the high- speed cameras are capable of much higher capture rates, for this test they were set to an appropriate frame rate of 14,400fps to maximize spatial resolution while acquiring an adequate number of images during the event. The cameras were post-trigger at a resolution of 1024 x 400 pixels. After the event, the images are transferred to the computer’s hard drive, and then post-processed using Vic-3D analysis software.
Images courtesy of Amos Gilat & Jeremy Seidt at Ohio State University.
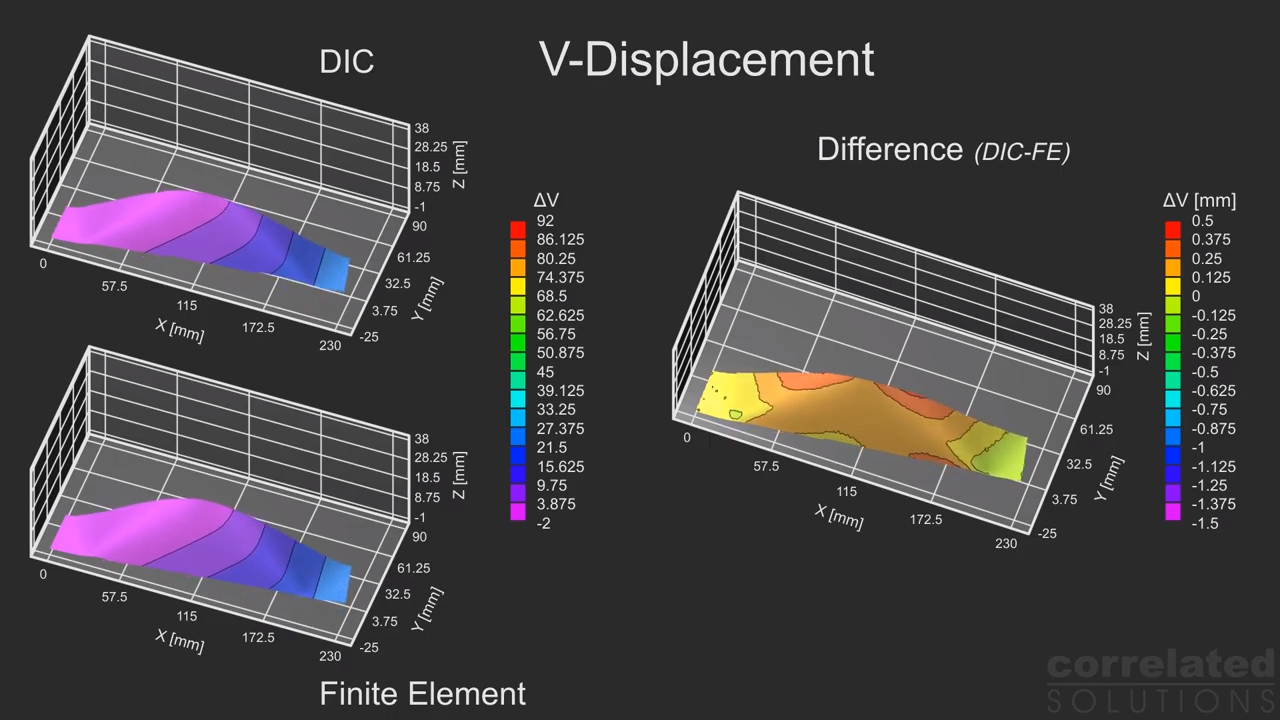
 Airbus has built a reputation for innovative aircraft, recognized around the world for their safety and efficiency. All of these attributes are driven by a top-notch testing program, whose innovative practice are evidenced by their use of the
 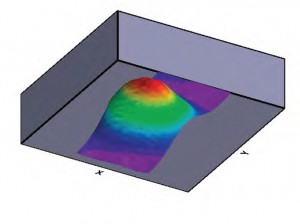 Dr. Richard Burguete, experimental mechanics specialist at Airbus UK since 1997, explains the benefits of this approach as follows: “The VIC-3D system allows us to be sure we have captured all of the relevant data, some of which might have otherwise been unobtainable.”
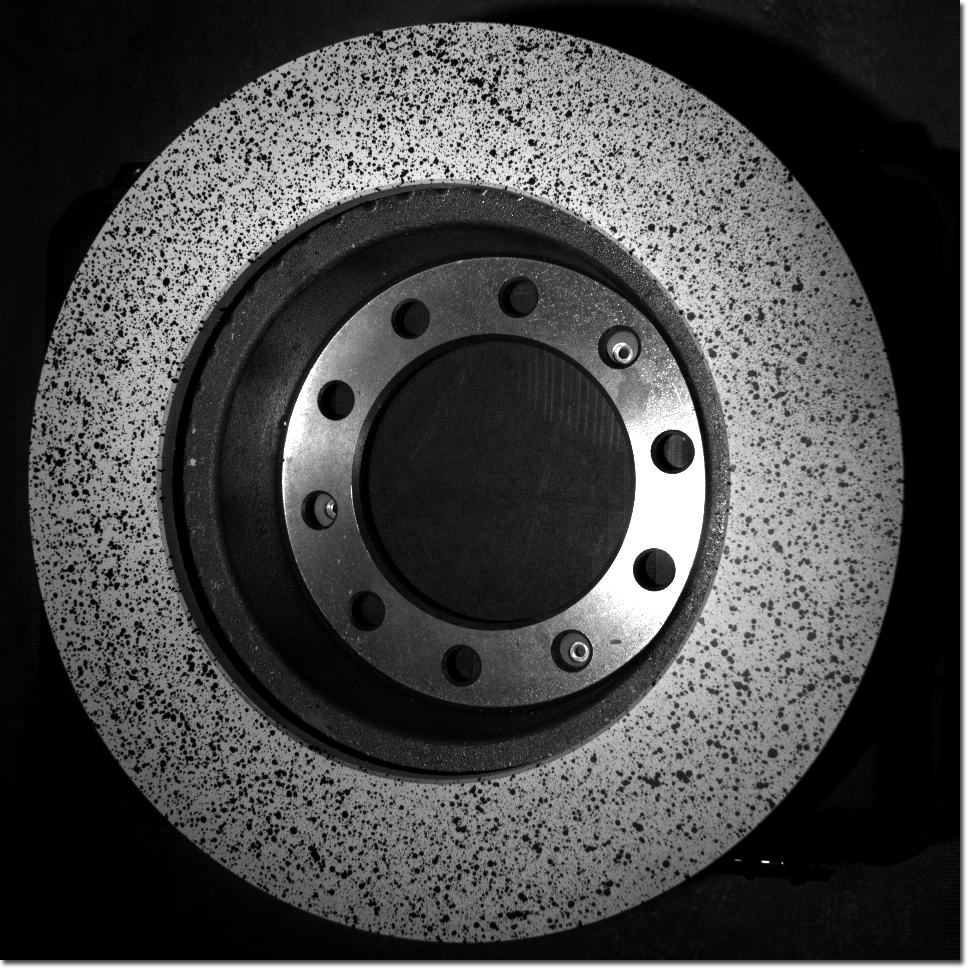
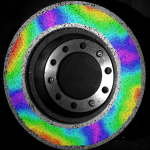
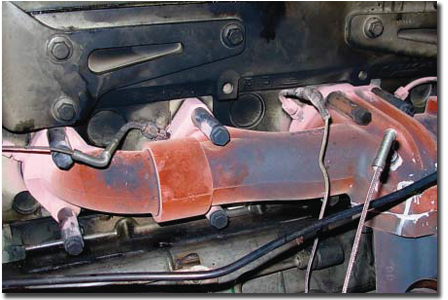 The engineers at Cummins design and test their engines to withstand real-world conditions, ranging from military deployments to heavy-duty industrial sites. Cummins engineers want to know exactly how their parts are deforming under the combination of thermal and mechanical loads. This means they’ve got to perform their tests with the engines running – and hot.